OPEN-SOURCE SCRIPT
Stock Performance Dashboard + Sector Performance
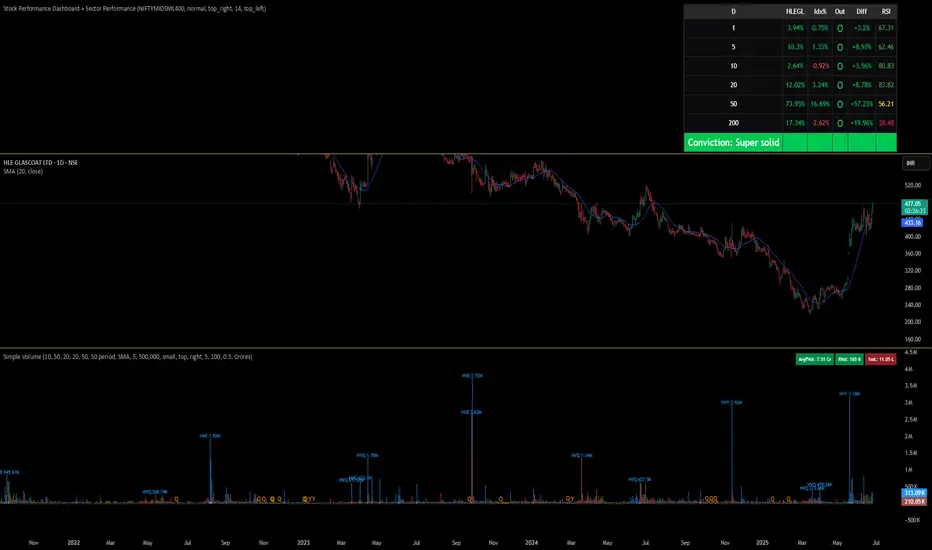
This indicator, Stock Performance Dashboard + Sector Performance, provides a comprehensive visual analysis of both individual stock performance and sectoral trends directly on your TradingView chart.
Key Features:
Performance Dashboard Table:
Displays the stock’s returns over multiple timeframes (1, 5, 10, 20, 50, 200 days) and compares them to a selected benchmark index (default: NIFTYMIDSML400).
Highlights whether the stock is outperforming the index for each period, shows the difference in performance, and includes an RSI (Relative Strength Index) column for additional momentum insight.
Calculates and displays a “conviction” score and level based on how often the stock outperforms the index across periods.
Sector Performance Table:
Ranks and displays the top-performing sectors from a predefined list of major NSE sector indices over four key periods (1D, 5D, 30D, 50D).
For each period, the top 5 sectors are shown, with color-coded performance for quick visual assessment.
Customization:
Includes options for dark/light mode, table size, position, and which columns to display.
Supports a compact “mini mode” for simplified visualization.
Usage:
This tool is ideal for traders and investors who want a quick, at-a-glance comparison of a stock’s short- and long-term momentum versus its benchmark, as well as a live snapshot of sector rotation and leadership in the Indian market. All data is presented in clear, color-coded tables for actionable decision-making.
Open-source Skript
Ganz im Sinne von TradingView hat dieser Autor sein/ihr Script als Open-Source veröffentlicht. Auf diese Weise können nun auch andere Trader das Script rezensieren und die Funktionalität überprüfen. Vielen Dank an den Autor! Sie können das Script kostenlos verwenden, aber eine Wiederveröffentlichung des Codes unterliegt unseren Hausregeln.
Haftungsausschluss
Die Informationen und Veröffentlichungen sind nicht als Finanz-, Anlage-, Handels- oder andere Arten von Ratschlägen oder Empfehlungen gedacht, die von TradingView bereitgestellt oder gebilligt werden, und stellen diese nicht dar. Lesen Sie mehr in den Nutzungsbedingungen.