OPEN-SOURCE SCRIPT
Aktualisiert Watchlist Heatmap Plus
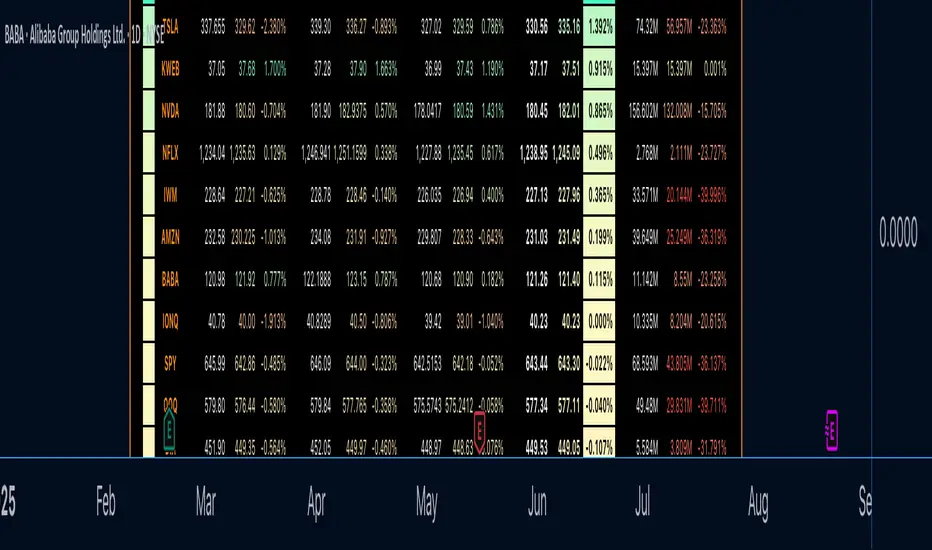
Introducing 'Watchlist Heatmap Plus,' an advanced indicator designed to supercharge your trading experience. With this tool, you can easily track up to 40 symbols in your watchlist and gain valuable insights into their performance. Here's what it does:
1. Data Visualization: Watchlist Heatmap Plus displays essential data for each symbol, including open, high, low, close, close percent, volume, and volume percent.
2. Dynamic Color Coding: The indicator leverages a dynamic color-coding system to make data interpretation a breeze. By default, red indicates a decrease or a lower value compared to the immediate previous candle, while green represents an increase or a higher value. This color scheme is consistently applied to open, high, low, close, and volume data, making it easy to spot trends at a glance. Close percent and volume percent are color-coded according to their actual values.
3. Customization Options: Users have the power to customize the displayed data to align with their trading strategy. They can choose from several data display options:
- Regular: Display the original data as is.
- Change: Show the difference between the current value and the previous candle.
- Change Percent: Display the percentage change between the current and previous values.
- Equal To, Less Than, Less Than or Equal To, Greater Than, Greater Than or Equal To: Perform comparison operations between the current and previous value, producing a boolean output.
4. Consistent Color Coding: Regardless of the data display option chosen, the color-coding functionality remains the same, based on the percentage change, allowing traders to quickly assess the health of each symbol.
Performance Considerations:
Please be aware that due to the complexity of this indicator and the substantial volume of data requests it handles, users may experience occasional data lag and performance slowdown, particularly when applied to certain timeframes. In some cases, there may be a risk of memory exhaustion, especially on smaller timeframes.
To optimize your experience and ensure smooth functionality, I recommend using this indicator on higher timeframes where data processing is less resource-intensive. Additionally, when using the indicator with the chart's replay feature, be cautious as it may encounter memory limits, affecting its performance.
Versionshinweise
Update: Historical Data Tracking Now Available!- Added Historical Data Tracking: Enhanced the Watchlist Heatmap Plus indicator to allow you to track historical data. You can now delve into the past to analyze how the market performed using this indicator.
- Nth Number Compatibility: The script has been updated to accept the nth number for charts or custom timeframes. By specifying the nth number, users can seamlessly assess both current and historical market performance, translating the results into the indicator's heatmap.
Versionshinweise
Added a dynamic currency formatter. Credit to CryptoArch_ for finding the bug and help. Versionshinweise
Tools library version updateVersionshinweise
Versions updated for imported libraries, and minor formatting fix.Versionshinweise
Bug Fix: The 'open' source field had a bug which prevented it from displaying the gradient colors and instead locked in a yellow color. This issue is now resolved.Versionshinweise
Now fully rewritten in Pine Script version 6 with major improvements and powerful new features!🚀 New Features:
- Track Your Positions – Seamlessly add and monitor your positions directly within the watchlist. Both long an short positions are allowed.
- Sentiment Metrics – Get detailed sentiment analysis for each category of data: Open, High, Low, Close, and Volume.
- Composite Weighted Sentiment – Calculates an overall sentiment using category-based data and custom weights.
- Comprehensive Data Display – Previous, Last, and % change values are now included under each category.
- Interactive Tooltips – Hover over items to see detailed explanations and insights.
- Trend Tracker – Displays total bullish and bearish trends for each category at a glance.
✨ Improvements:
- Clean and simple Interface – Complete visual overhaul for a cleaner, more intuitive look.
- Updated to Pine Script v6 – Enhanced compatibility, performance, and efficiency.
- Enhanced Customization – Personalize the watchlist to fit your style.
Versionshinweise
Refactoring and few adjustments:- updated tooltips with sentiment, trend, weight calculation breakdown
- watchlist frame color now reflects overall sentiment
- added global text size
Versionshinweise
Fixed the Weighted Composite Sentiment to calculate volume-adjusted close (with cap and penalty enhancements) for more accurate price-volume interaction, while simplifying weight inputs to a 0-1 scale with 0.1 increments for finer control.Versionshinweise
quick refactoring Versionshinweise
Refreshed look and few bug fixes.Versionshinweise
Bug fix: total_rows calculation fixedVersionshinweise
Minor bug fix and code update.Open-source Skript
Ganz im Sinne von TradingView hat dieser Autor sein/ihr Script als Open-Source veröffentlicht. Auf diese Weise können nun auch andere Trader das Script rezensieren und die Funktionalität überprüfen. Vielen Dank an den Autor! Sie können das Script kostenlos verwenden, aber eine Wiederveröffentlichung des Codes unterliegt unseren Hausregeln.
Faiyaz Haider
Haftungsausschluss
Die Informationen und Veröffentlichungen sind nicht als Finanz-, Anlage-, Handels- oder andere Arten von Ratschlägen oder Empfehlungen gedacht, die von TradingView bereitgestellt oder gebilligt werden, und stellen diese nicht dar. Lesen Sie mehr in den Nutzungsbedingungen.
Open-source Skript
Ganz im Sinne von TradingView hat dieser Autor sein/ihr Script als Open-Source veröffentlicht. Auf diese Weise können nun auch andere Trader das Script rezensieren und die Funktionalität überprüfen. Vielen Dank an den Autor! Sie können das Script kostenlos verwenden, aber eine Wiederveröffentlichung des Codes unterliegt unseren Hausregeln.
Faiyaz Haider
Haftungsausschluss
Die Informationen und Veröffentlichungen sind nicht als Finanz-, Anlage-, Handels- oder andere Arten von Ratschlägen oder Empfehlungen gedacht, die von TradingView bereitgestellt oder gebilligt werden, und stellen diese nicht dar. Lesen Sie mehr in den Nutzungsbedingungen.