OPEN-SOURCE SCRIPT
Chart Fusion Line SND Detection & Signals by TitikSona
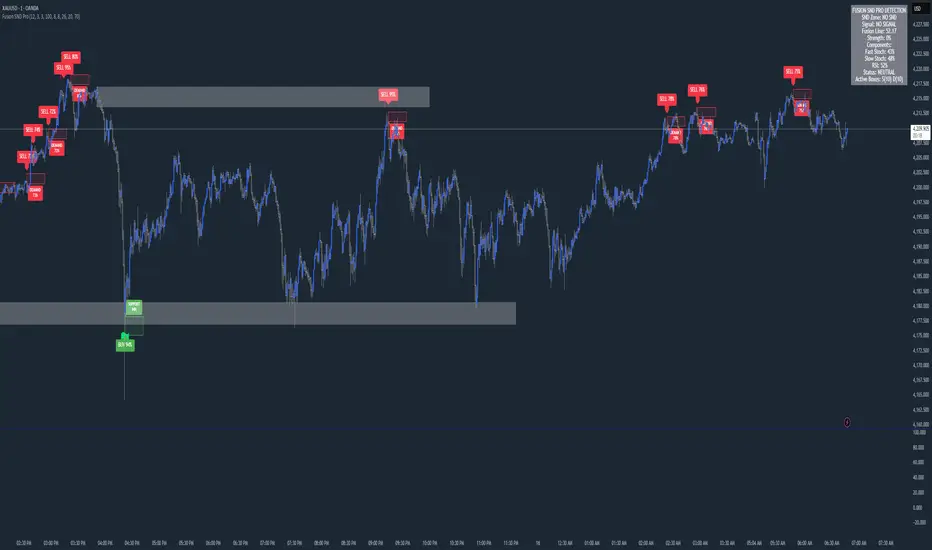
### Overview
Fusion Line Momentum Analyzer merges Double Stochastic and RSI into a single adaptive oscillator that visualizes momentum direction and strength.
It helps identify overbought and oversold conditions through a smooth blended curve that adapts across timeframes.
Designed for analytical purposes and to simplify momentum reading without complex triggers or repainting methods.
---
### Core Idea
The indicator fuses three classical momentum tools:
- Fast Stochastic (12,3,3) for short-term swings
- Slow Stochastic (100,8,8) for long-term momentum stability
- RSI (26) for measuring internal strength between buyers and sellers
These three are normalized and averaged into one unified line called the **Fusion Line**.
A secondary smoothing layer, the **Signal Line**, refines the direction and removes minor fluctuations.
---
### Features
- Unified momentum line combining Fast and Slow Stochastic with RSI
- Real-time momentum strength percentage (adaptive scale)
- Color-coded momentum bias for easy interpretation
- Optional info box showing component strength and overall state
- Background shading to visualize dominant momentum direction
- Optional alerts when Fusion Line crosses common momentum zones (20 and 80)
---
### Default Parameters
Fast Stochastic (12,3,3)
Slow Stochastic (100,8,8)
RSI Length (26)
Signal Line Smoothing (9)
All parameters can be modified to match volatility or personal style.
---
### How to Read
- A rising Fusion Line often reflects strengthening bullish momentum.
- A falling Fusion Line often reflects increasing bearish pressure.
- Strength percentage represents how dominant the current bias is.
- Extreme levels (near 20 or 80) indicate potential exhaustion or recovery areas.
Always interpret readings with market context such as trend direction, structure, and volume.
---
### Interpretation Guide
Low Fusion levels may indicate possible accumulation or recovery.
High Fusion levels may signal overextension or slowing momentum.
Neutral mid-levels represent balance between buying and selling pressure.
---
### Disclaimer
This script is an analytical visualization tool for studying market momentum.
It does not generate trading signals or predict market direction.
Always combine with structure, volume, and higher-timeframe context before making any trading decisions.
---
### Developer
Created by **TitikSona** — Research & Fusion Concept Designer
Built using **Pine Script v6**
Type: Open-source educational script
---
### Short Description
Adaptive momentum analyzer combining Double Stochastic and RSI into one Fusion Line with real-time strength visualization.
Open-source Skript
Ganz im Sinne von TradingView hat dieser Autor sein/ihr Script als Open-Source veröffentlicht. Auf diese Weise können nun auch andere Trader das Script rezensieren und die Funktionalität überprüfen. Vielen Dank an den Autor! Sie können das Script kostenlos verwenden, aber eine Wiederveröffentlichung des Codes unterliegt unseren Hausregeln.
Haftungsausschluss
Die Informationen und Veröffentlichungen sind nicht als Finanz-, Anlage-, Handels- oder andere Arten von Ratschlägen oder Empfehlungen gedacht, die von TradingView bereitgestellt oder gebilligt werden, und stellen diese nicht dar. Lesen Sie mehr in den Nutzungsbedingungen.