OPEN-SOURCE SCRIPT
Savages Supply and Demand Levels
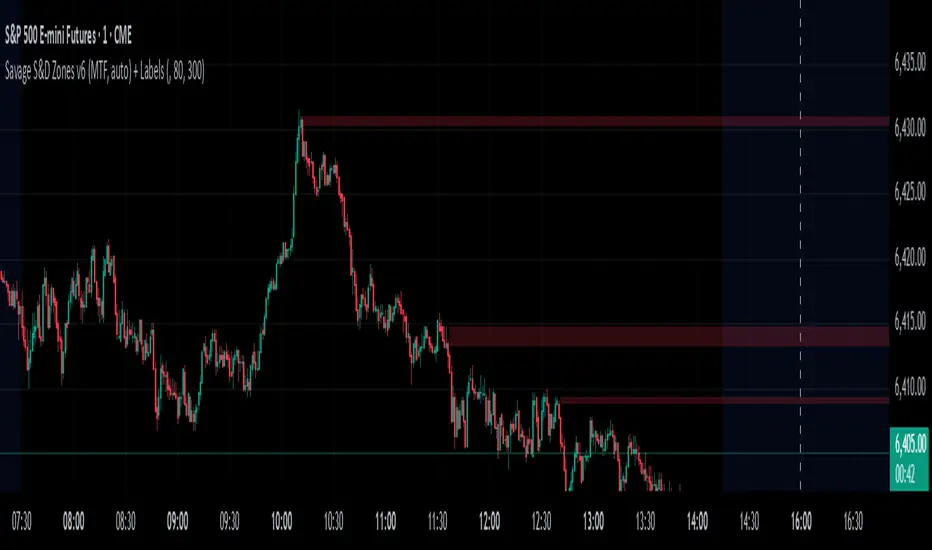
This supply and demand indicator in my opinion is one of the best S&D indicators on trading view. It is clean, organized and just simple. I have spent thousands of hours determining the best and most reliable ways to identify supply and demand, on every time frame! I am going to explain exactly what I look for.
When looking for a supply level meaning, there is potential for more supply of the following stock to hit the marker, what does that mean? People are going to sell. SO, it represents possible sell ordered at that supply level. So lets get into the grit of this, there are two candles that form when a supply level is formed. The first candle needs to be green, it will have a high, a low , an open and a close. The specifics come into play with the next candle which needs to be red, that candle can NOT break the previous green candles high, and needs to close below the previous candles low. THATS IT! That is a supply level. Now, for a demand level, its the same thing just switched, we need a red candle, that will have a high,low, open and a close. Same thing now, the next candle is going to be green, that green candle can NOT break that previous red candles low and needs to close above that previous red candles high. THATS A DEMAND!
I have spent countless hours back testing and studying this, I am extremely confident that this will be a game changer for whoever uses this. I have marked different types of opening and closes and highs and lows and this specific type of setup has worked countless times for me, the only time it will not work is when there is a liquidity sweep or some sort of news where it causes the price action to swing several points. Also do not use only one time frame and only this indicator, try to use some fair value gap levels and break of structure indicators, there are really good ones on here. I have also built the indicator to get rid of supply and demand levels that have already been hit so you always have a clean and fresh supply and demand level that has not been eaten into yet. I also threw some clean labels on there so it is easy to identify. So once price action hits that supply or demand level, it goes away, it either worked or it gets invalidated.
I hope you enjoy!
Not financial advice
-Savage
Open-source Skript
Ganz im Sinne von TradingView hat dieser Autor sein/ihr Script als Open-Source veröffentlicht. Auf diese Weise können nun auch andere Trader das Script rezensieren und die Funktionalität überprüfen. Vielen Dank an den Autor! Sie können das Script kostenlos verwenden, aber eine Wiederveröffentlichung des Codes unterliegt unseren Hausregeln.
Haftungsausschluss
Die Informationen und Veröffentlichungen sind nicht als Finanz-, Anlage-, Handels- oder andere Arten von Ratschlägen oder Empfehlungen gedacht, die von TradingView bereitgestellt oder gebilligt werden, und stellen diese nicht dar. Lesen Sie mehr in den Nutzungsbedingungen.