OPEN-SOURCE SCRIPT
BB Running Away Candle
Hello,
here is an indicator that can be helpful for your trading that is simple and easy to use.
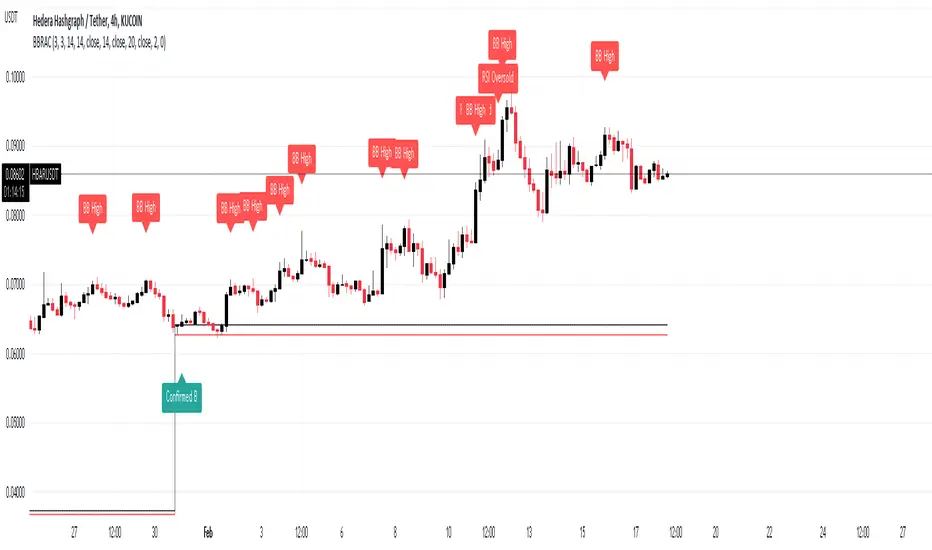
Our culprit here is a candle that opens and closes below the lower band of Bollinger Band, Black and red lines are put on the high and low of that candle.
Green Arrows are happening when:
1- When candle closes above the black line [the high of culprit candle] and Stochastic RSI is in the oversold area >> "Confirmed B"
2- When candle closes above the black line[the high of culprit candle] >> "B"
Note that you can choose from the settings whether you want it confirmed or not.
Red Arrows are happening when:
1- Price reached the higher band of Bollinger Bands >> "BB High"
2- Stochastic crosses down from above 80 level >> "Stoch Crossdown"
3- RSI reached above 70 levle >> "RSI Oversold"
Note that you can choose to turn these on or off from the settings.
Settings of indicators are set to default.
NOTE: Alerts are put there however i didn't get the chance to test them, so would like to hear your feedback about them.
THE USE OF THIS INDICATOR IS YOUR OWN RESPONSIBILITY.
wishing you the best.
here is an indicator that can be helpful for your trading that is simple and easy to use.
Our culprit here is a candle that opens and closes below the lower band of Bollinger Band, Black and red lines are put on the high and low of that candle.
Green Arrows are happening when:
1- When candle closes above the black line [the high of culprit candle] and Stochastic RSI is in the oversold area >> "Confirmed B"
2- When candle closes above the black line[the high of culprit candle] >> "B"
Note that you can choose from the settings whether you want it confirmed or not.
Red Arrows are happening when:
1- Price reached the higher band of Bollinger Bands >> "BB High"
2- Stochastic crosses down from above 80 level >> "Stoch Crossdown"
3- RSI reached above 70 levle >> "RSI Oversold"
Note that you can choose to turn these on or off from the settings.
Settings of indicators are set to default.
NOTE: Alerts are put there however i didn't get the chance to test them, so would like to hear your feedback about them.
THE USE OF THIS INDICATOR IS YOUR OWN RESPONSIBILITY.
wishing you the best.
Open-source Skript
Ganz im Sinne von TradingView hat dieser Autor sein/ihr Script als Open-Source veröffentlicht. Auf diese Weise können nun auch andere Trader das Script rezensieren und die Funktionalität überprüfen. Vielen Dank an den Autor! Sie können das Script kostenlos verwenden, aber eine Wiederveröffentlichung des Codes unterliegt unseren Hausregeln.
Haftungsausschluss
Die Informationen und Veröffentlichungen sind nicht als Finanz-, Anlage-, Handels- oder andere Arten von Ratschlägen oder Empfehlungen gedacht, die von TradingView bereitgestellt oder gebilligt werden, und stellen diese nicht dar. Lesen Sie mehr in den Nutzungsbedingungen.