OPEN-SOURCE SCRIPT
Previous 4-Hour High/Low
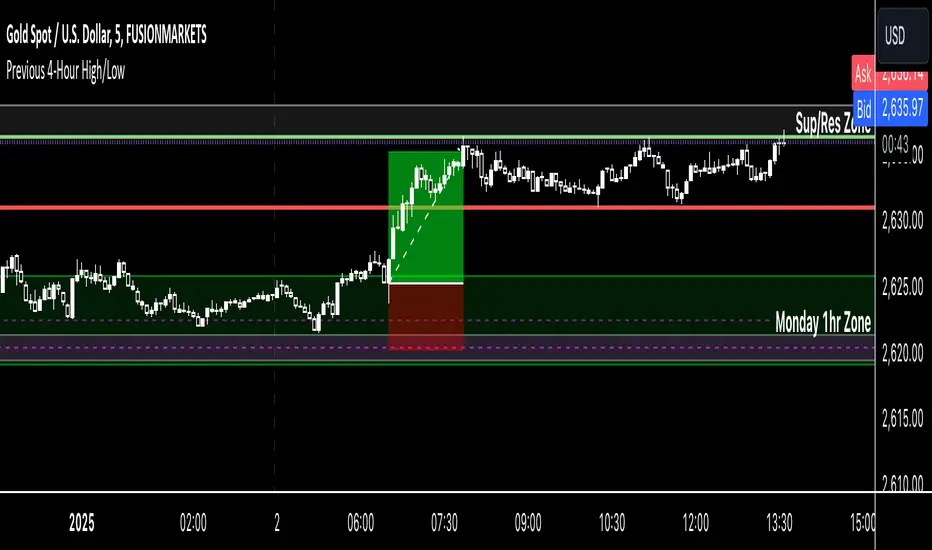
Indicator Name: Previous 4-Hour High/Low Lines
Description:
This indicator highlights the high and low levels of the previous candle from a user-defined timeframe (default: 4 hours) and extends these levels both to the left and right across the chart. It allows traders to visualize key support and resistance levels from higher timeframes while analyzing lower timeframe charts.
Key Features:
• Customizable Timeframe: Select any timeframe (e.g., 4-hour, daily) to track the high and low of the previous candle.
• Dynamic Updates: The high and low levels update automatically with each new candle.
• Extended Levels: Lines extend both left and right, providing a clear reference for past and future price action.
• Overlay on Chart: The indicator works seamlessly on any timeframe, making it ideal for multi-timeframe analysis.
Use Case:
This tool is perfect for traders who rely on higher timeframe levels for setting entry/exit points, identifying potential breakout zones, or managing risk. By visualizing these levels directly on lower timeframe charts, traders can make informed decisions without switching between charts.
Open-source Skript
Ganz im Sinne von TradingView hat dieser Autor sein/ihr Script als Open-Source veröffentlicht. Auf diese Weise können nun auch andere Trader das Script rezensieren und die Funktionalität überprüfen. Vielen Dank an den Autor! Sie können das Script kostenlos verwenden, aber eine Wiederveröffentlichung des Codes unterliegt unseren Hausregeln.
Haftungsausschluss
Die Informationen und Veröffentlichungen sind nicht als Finanz-, Anlage-, Handels- oder andere Arten von Ratschlägen oder Empfehlungen gedacht, die von TradingView bereitgestellt oder gebilligt werden, und stellen diese nicht dar. Lesen Sie mehr in den Nutzungsbedingungen.