OPEN-SOURCE SCRIPT
1% Range Bars with Sequence Table

Overall Logic:
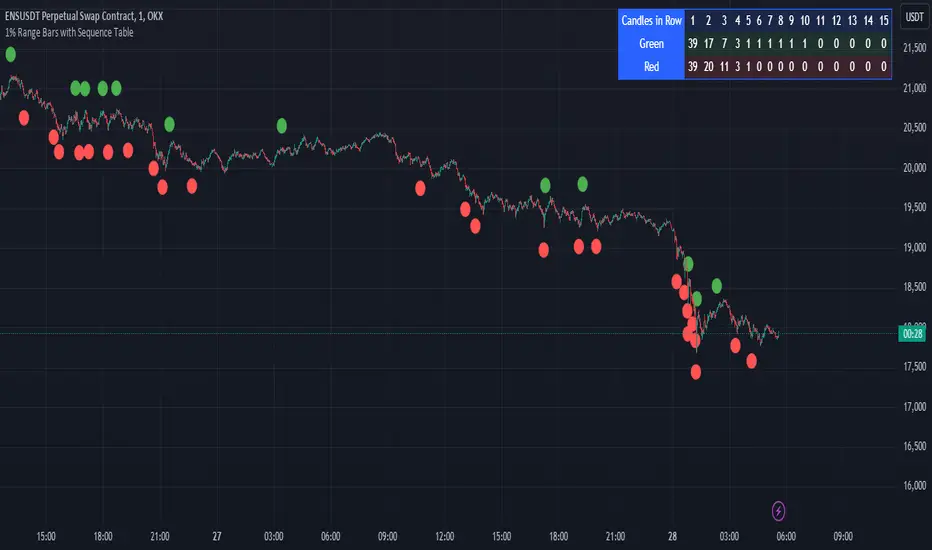
The script is designed to help traders visualize and analyze price movements on the chart, where each 1% movement is highlighted with a corresponding symbol. Additionally, the table helps track and analyze the number and length of consecutive price movements in one direction, which can be useful for identifying trends and understanding market dynamics.
This script can be particularly useful for traders looking for recurring patterns in price movements and wanting to quickly identify significant changes on the chart.
Main elements of the script:
Price Percentage Change:
The script tracks the price movement by 1% from the last significant value (the value at which the last 1% change was recorded).
If the price rises by 1% or more, a green circle is displayed above the bar.
If the price drops by 1% or more, a red circle is displayed below the bar.
Sequence Counting:
The script counts the number of consecutive 1% moves upwards (green circles) and downwards (red circles).
Separate counters are maintained for upward and downward movements, increasing each time the respective movement occurs.
If an opposite movement interrupts the sequence, the counter for the opposite direction is reset.
Sequence Table:
A table displayed on the chart shows the number of sequences of 1% movements in one direction for lengths from 1 to 15 bars.
The table is updated in real-time and shows how many times sequences of a certain length occurred on the chart, where the price moved by 1% in one direction.
Open-source Skript
Ganz im Sinne von TradingView hat dieser Autor sein/ihr Script als Open-Source veröffentlicht. Auf diese Weise können nun auch andere Trader das Script rezensieren und die Funktionalität überprüfen. Vielen Dank an den Autor! Sie können das Script kostenlos verwenden, aber eine Wiederveröffentlichung des Codes unterliegt unseren Hausregeln.
Haftungsausschluss
Die Informationen und Veröffentlichungen sind nicht als Finanz-, Anlage-, Handels- oder andere Arten von Ratschlägen oder Empfehlungen gedacht, die von TradingView bereitgestellt oder gebilligt werden, und stellen diese nicht dar. Lesen Sie mehr in den Nutzungsbedingungen.