Hello!
BE SURE TO RUN THE SCRIPT WITH BAR REPLAY TO SEE WHAT IT DOES! I hope you like it!
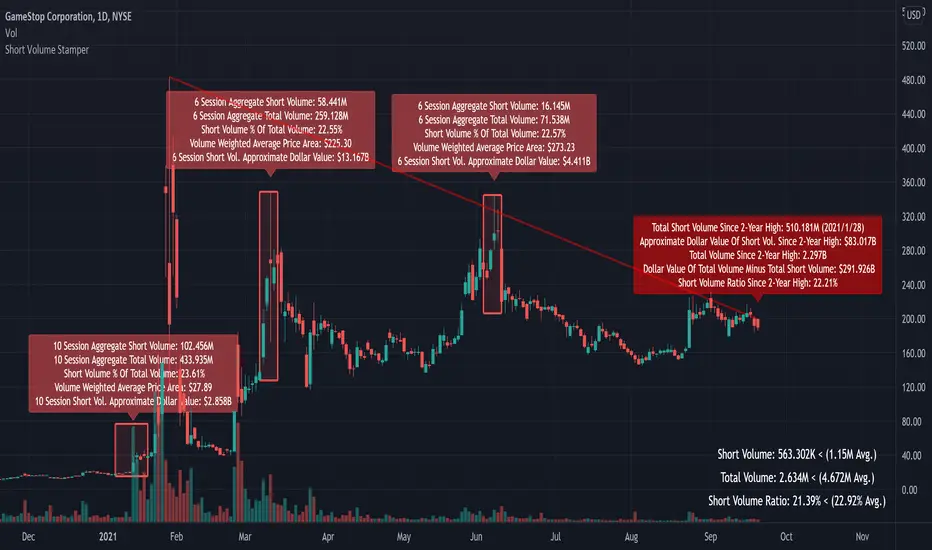
This script calculates the total short volume, total volume, and the short volume / total volume ratio since the 2-year high price. In addition, the approximate dollar value of all short volume since the 2-year high, and the approximate dollar value of all non-short sell volume since the 2-year high is calculated using VWAP. A red line (short interest ratio >= 20%) connects the 2-year high to current session’s high price; a green line (short interest ratio < 20%) connects the 2-year high to the current session’s high.
The script also “stamps” sessions in which a NEW 1-year high in SHORT volume is achieved, and when a PIVOT POINT high is achieved (highest high over 51 sessions). When a new high in short volume is achieved the script aggregates the total volume and short volume for the 5 sessions prior to the new high, the session of the new high, and the 4 sessions after the new high (10 sessions). Additional volume calculations are performed for the 10 session period!
When a pivot point high is achieved the script aggregates the total volume and short volume for the 3 sessions prior to the pivot high, the session of the pivot high, and the 2 sessions after the new high (6 sessions). Additional volume calculations are performed for the 6 session period!
Red labels, red boxes, and red lines indicate a short volume ratio greater than or equal to 20% over the corresponding period!
Green labels, green boxes, and green lines indicate a short volume ratio less than 20% over the corresponding period!
BE SURE TO RUN THE SCRIPT WITH BAR REPLAY TO SEE WHAT IT DOES! I hope you like it!
This script calculates the total short volume, total volume, and the short volume / total volume ratio since the 2-year high price. In addition, the approximate dollar value of all short volume since the 2-year high, and the approximate dollar value of all non-short sell volume since the 2-year high is calculated using VWAP. A red line (short interest ratio >= 20%) connects the 2-year high to current session’s high price; a green line (short interest ratio < 20%) connects the 2-year high to the current session’s high.
The script also “stamps” sessions in which a NEW 1-year high in SHORT volume is achieved, and when a PIVOT POINT high is achieved (highest high over 51 sessions). When a new high in short volume is achieved the script aggregates the total volume and short volume for the 5 sessions prior to the new high, the session of the new high, and the 4 sessions after the new high (10 sessions). Additional volume calculations are performed for the 10 session period!
When a pivot point high is achieved the script aggregates the total volume and short volume for the 3 sessions prior to the pivot high, the session of the pivot high, and the 2 sessions after the new high (6 sessions). Additional volume calculations are performed for the 6 session period!
Red labels, red boxes, and red lines indicate a short volume ratio greater than or equal to 20% over the corresponding period!
Green labels, green boxes, and green lines indicate a short volume ratio less than 20% over the corresponding period!
Versionshinweise
Changed the tracking label y-axis plot. The tracking label will trail price a bit tighter!Versionshinweise
Added nameVersionshinweise
Memory calculation compliantOpen-source Skript
Ganz im Sinne von TradingView hat dieser Autor sein/ihr Script als Open-Source veröffentlicht. Auf diese Weise können nun auch andere Trader das Script rezensieren und die Funktionalität überprüfen. Vielen Dank an den Autor! Sie können das Script kostenlos verwenden, aber eine Wiederveröffentlichung des Codes unterliegt unseren Hausregeln.
•Access to Next-Gen Optimization Tools: tradingiq.io
•Discord Server: discord.gg/aKWPuM4HPy
•Discord Server: discord.gg/aKWPuM4HPy
Haftungsausschluss
Die Informationen und Veröffentlichungen sind nicht als Finanz-, Anlage-, Handels- oder andere Arten von Ratschlägen oder Empfehlungen gedacht, die von TradingView bereitgestellt oder gebilligt werden, und stellen diese nicht dar. Lesen Sie mehr in den Nutzungsbedingungen.
Open-source Skript
Ganz im Sinne von TradingView hat dieser Autor sein/ihr Script als Open-Source veröffentlicht. Auf diese Weise können nun auch andere Trader das Script rezensieren und die Funktionalität überprüfen. Vielen Dank an den Autor! Sie können das Script kostenlos verwenden, aber eine Wiederveröffentlichung des Codes unterliegt unseren Hausregeln.
•Access to Next-Gen Optimization Tools: tradingiq.io
•Discord Server: discord.gg/aKWPuM4HPy
•Discord Server: discord.gg/aKWPuM4HPy
Haftungsausschluss
Die Informationen und Veröffentlichungen sind nicht als Finanz-, Anlage-, Handels- oder andere Arten von Ratschlägen oder Empfehlungen gedacht, die von TradingView bereitgestellt oder gebilligt werden, und stellen diese nicht dar. Lesen Sie mehr in den Nutzungsbedingungen.