OPEN-SOURCE SCRIPT
Loacally Weighted MA (LWMA) Direction Histogram

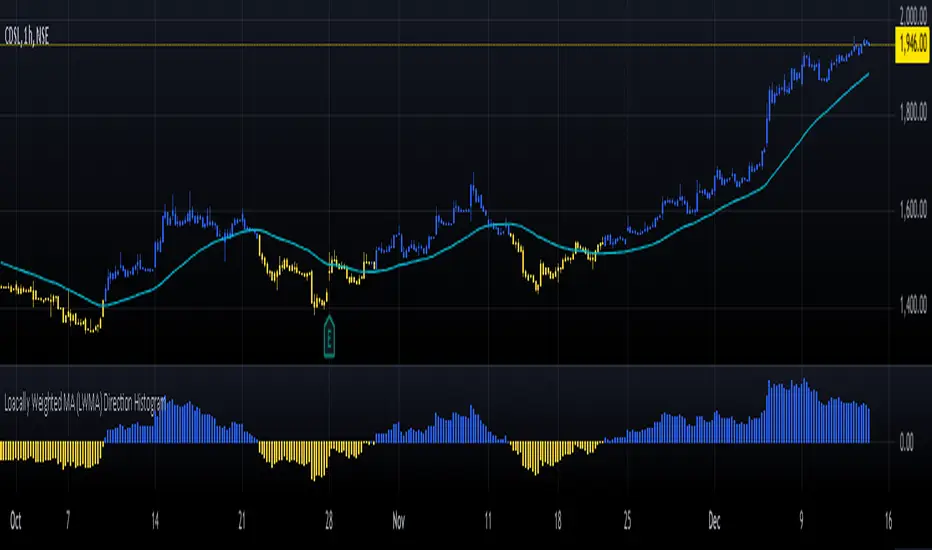
The Locally Weighted Moving Average (LWMA) Direction Histogram indicator is designed to provide traders with a visual representation of the price momentum and trend direction. This Pine Script, written in version 6, calculates an LWMA by assigning higher weights to recent data points, emphasizing the most current market movements. The script incorporates user-defined input parameters, such as the LWMA length and a direction lookback period, making it flexible to adapt to various trading strategies and preferences.
The histogram visually represents the difference between the current LWMA and a previous LWMA value (based on the lookback period). Positive values are colored blue, indicating upward momentum, while negative values are yellow, signaling downward movement. Additionally, the script colors candlesticks according to the histogram's value, enhancing clarity for users analyzing market trends. The LWMA line itself is plotted on the chart but hidden by default, enabling traders to toggle its visibility as needed. This blend of histogram and candlestick visualization offers a comprehensive tool for identifying shifts in momentum and potential trading opportunities.
The histogram visually represents the difference between the current LWMA and a previous LWMA value (based on the lookback period). Positive values are colored blue, indicating upward momentum, while negative values are yellow, signaling downward movement. Additionally, the script colors candlesticks according to the histogram's value, enhancing clarity for users analyzing market trends. The LWMA line itself is plotted on the chart but hidden by default, enabling traders to toggle its visibility as needed. This blend of histogram and candlestick visualization offers a comprehensive tool for identifying shifts in momentum and potential trading opportunities.
Open-source Skript
Ganz im Sinne von TradingView hat dieser Autor sein/ihr Script als Open-Source veröffentlicht. Auf diese Weise können nun auch andere Trader das Script rezensieren und die Funktionalität überprüfen. Vielen Dank an den Autor! Sie können das Script kostenlos verwenden, aber eine Wiederveröffentlichung des Codes unterliegt unseren Hausregeln.
Haftungsausschluss
Die Informationen und Veröffentlichungen sind nicht als Finanz-, Anlage-, Handels- oder andere Arten von Ratschlägen oder Empfehlungen gedacht, die von TradingView bereitgestellt oder gebilligt werden, und stellen diese nicht dar. Lesen Sie mehr in den Nutzungsbedingungen.