OPEN-SOURCE SCRIPT
Candlestick based on volume

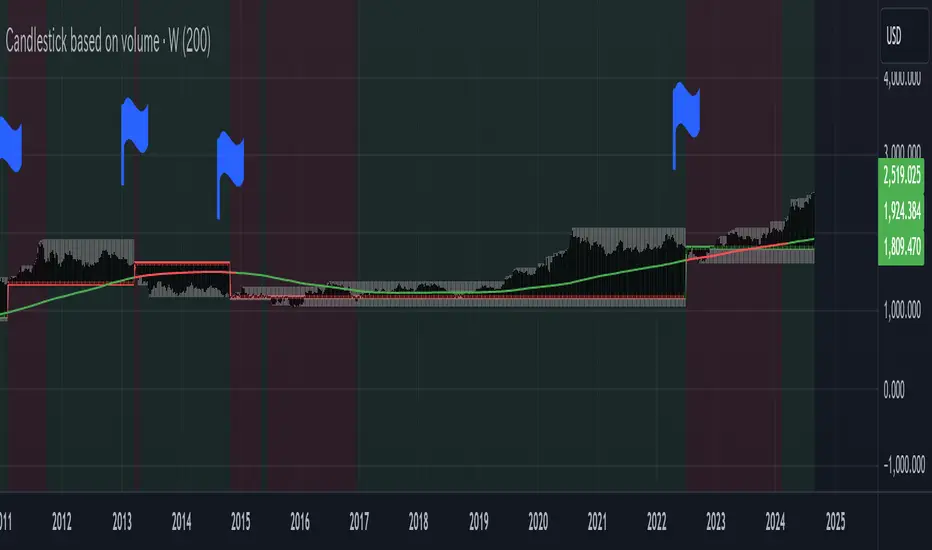
This code is an indicator for drawing custom candle charts based on volume and analyzing price fluctuations and trends. A specific description is provided below:
Main functions and analysis details
Cumulative Volume Calculation
Accumulates the volume of all bars and calculates the cumulative volume. This gives an idea of the total volume of volume.
Counter Calculation
The value of the counter is determined by continuously dividing the accumulated volume by 2. This counter shows the change in volume.
Calculation of Counter Change and Duration
When the value of the counter changes, the duration of the change is calculated. This tells us how long the change in volume lasted.
Calculation of slope and angle
The slope is calculated from the amount of change in the counter and the period of time it took for the counter to change, and the angle is calculated from the slope. This allows you to visualize the trend of the volume change and the direction of the trend.
Setting Counter Color and Background Color
Set the color of the counter based on the period of change. Longer periods are displayed in red, and shorter periods in green. The background color also changes based on the angle, indicating the strength and direction of the trend.
Drawing Custom Candles
Draw custom candles based on volume changes. As the counter changes, a new candle is formed, highlighting the price movement.
Display of simple moving averages (SMA)
Calculates the average of prices over a selected period of time and displays that average. This smoothes out price trends and fluctuations and clearly shows the direction of the trend.
Comparison of the upper and lower lengths of candles
Calculates the upper and lower lengths of each candle (lower half and upper half) and changes the color of the SMA based on which is longer. This visualizes the effect of price fluctuations due to the shape of the candles.
Key Points of Use
Trend Analysis: Analyze the direction and strength of a trend using custom candles based on volume, background color, and tilt angle.
Change highlighting: Visually highlight important points with counter changes and flags.
Price Averaging: Use SMA to smooth price trends, reduce noise, and determine trend direction.
Open-source Skript
Ganz im Sinne von TradingView hat dieser Autor sein/ihr Script als Open-Source veröffentlicht. Auf diese Weise können nun auch andere Trader das Script rezensieren und die Funktionalität überprüfen. Vielen Dank an den Autor! Sie können das Script kostenlos verwenden, aber eine Wiederveröffentlichung des Codes unterliegt unseren Hausregeln.
Haftungsausschluss
Die Informationen und Veröffentlichungen sind nicht als Finanz-, Anlage-, Handels- oder andere Arten von Ratschlägen oder Empfehlungen gedacht, die von TradingView bereitgestellt oder gebilligt werden, und stellen diese nicht dar. Lesen Sie mehr in den Nutzungsbedingungen.