OPEN-SOURCE SCRIPT
Candle + Volume as Histogram
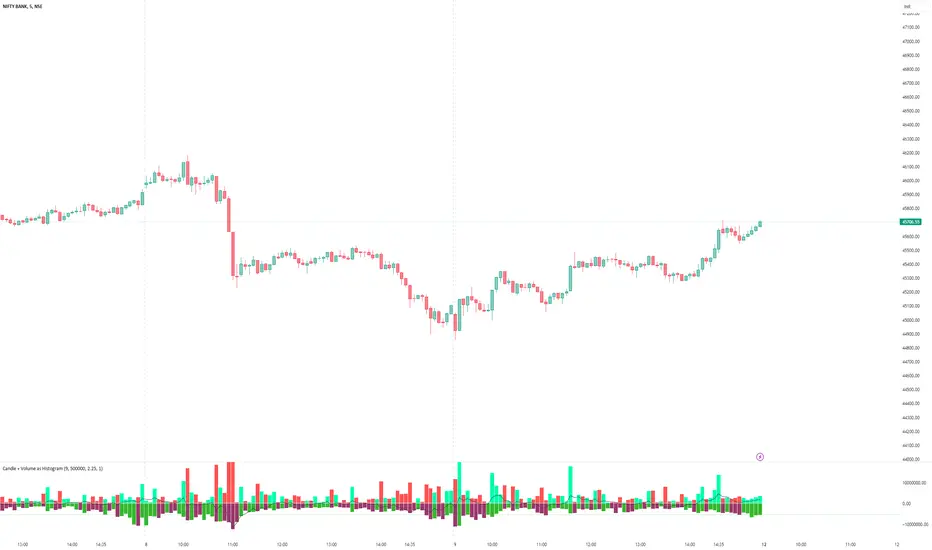
Now plot Candle and Volume as Histogram Oscillator. It is a very simple but very effective indicator to see what is happening at Volume and Candle levels. It clearly plots whether the market is trending, volatile, what is going to happen in next candles etc. Above Zero is price candle and below Zero is Volume histogram.
SETTINGS:
EMA : 9 period EMA on price is default, which I find the best, but you can change as you likes. Below zero line shows market is in negative phase and above zero market is positive.
PRICE CANDLE : As price and volume have different numeric value, so you have to use multiplier to set the proper price candle, which is plotted above zero
VOLUME : As price and volume have different numeric value, so you have to use multiplier to set the Volume candle, which is plotted below zero.
ZERO LINE : use ‘Gap between Candle and Volume plotting’. Increase the value until you see a thin line between price and volume histogram.
NOTE: (i) When you will plot the indicator for the first time, either price candle may not be appearing properly or volume. It means that non-appearing histogram side needs multiplication, so keep on increasing value on proper side until both side histogram appears properly.
(ii) In other case. Price or volume histogram may appear as full Candle. In this case too, you need to increase multiplier value on opposite side till value becomes equal on both sides.
These settings are important because a share price can be 10 only whereas volume may be in millions. Indicator has been tested on many shares and indexes, so never feels that indicator is improper. Just try to change the setting.
Enjoy.
Open-source Skript
Ganz im Sinne von TradingView hat dieser Autor sein/ihr Script als Open-Source veröffentlicht. Auf diese Weise können nun auch andere Trader das Script rezensieren und die Funktionalität überprüfen. Vielen Dank an den Autor! Sie können das Script kostenlos verwenden, aber eine Wiederveröffentlichung des Codes unterliegt unseren Hausregeln.
Haftungsausschluss
Die Informationen und Veröffentlichungen sind nicht als Finanz-, Anlage-, Handels- oder andere Arten von Ratschlägen oder Empfehlungen gedacht, die von TradingView bereitgestellt oder gebilligt werden, und stellen diese nicht dar. Lesen Sie mehr in den Nutzungsbedingungen.