OPEN-SOURCE SCRIPT
Candle Counter from 9:30 AM to 4:00 PM
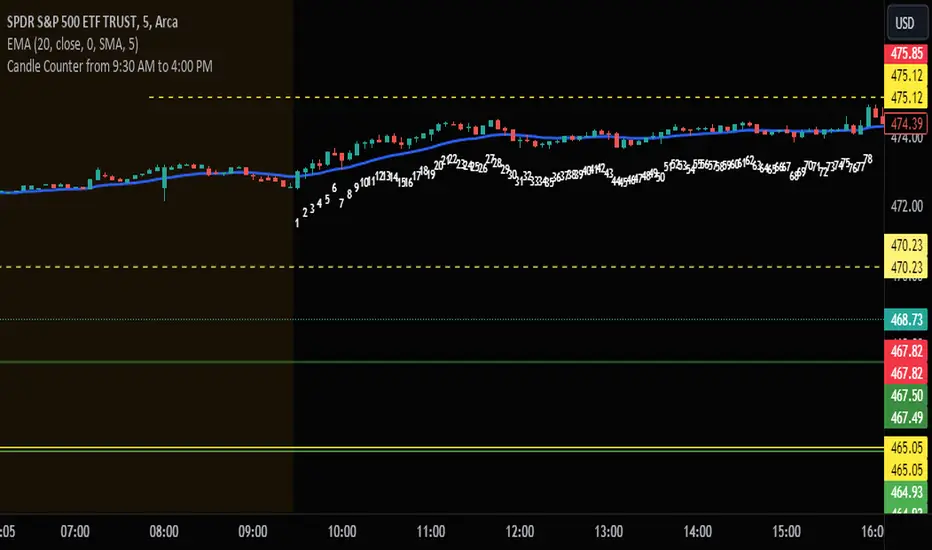
This Pine Script, designed for TradingView, serves as a candle counter exclusively for a 5-minute chart. It operates within the specific market hours of 9:30 AM to 4:00 PM. Key features of the script include:
Market Hours Specification: The script is configured to track candles only during the trading hours from 9:30 AM to 4:00 PM.
Daily Reset: Each trading day, the candle counter resets, starting anew from the market opening at 9:30 AM.
Candle Counting: It increments a counter with each 5-minute candle during the specified market hours.
Label Display: The counter number for each candle is displayed as a label at the candle's low point. This label is in bright white color with large font size, ensuring clear visibility against various chart backgrounds.
5-Minute Chart Specificity: The script is tailored to function only when the chart is set to a 5-minute timeframe, making it ideal for traders focusing on intraday movements.
New Day Detection: Utilizes a function to identify the start of a new trading day, ensuring accurate daily counting.
This script is particularly useful for traders who focus on intraday trading within the standard stock market hours, providing a clear and easy-to-read candle count that resets daily.
Open-source Skript
Ganz im Sinne von TradingView hat dieser Autor sein/ihr Script als Open-Source veröffentlicht. Auf diese Weise können nun auch andere Trader das Script rezensieren und die Funktionalität überprüfen. Vielen Dank an den Autor! Sie können das Script kostenlos verwenden, aber eine Wiederveröffentlichung des Codes unterliegt unseren Hausregeln.
Haftungsausschluss
Die Informationen und Veröffentlichungen sind nicht als Finanz-, Anlage-, Handels- oder andere Arten von Ratschlägen oder Empfehlungen gedacht, die von TradingView bereitgestellt oder gebilligt werden, und stellen diese nicht dar. Lesen Sie mehr in den Nutzungsbedingungen.