OPEN-SOURCE SCRIPT
Aktualisiert Daily Historical Volatility StdDev Levels
Description:
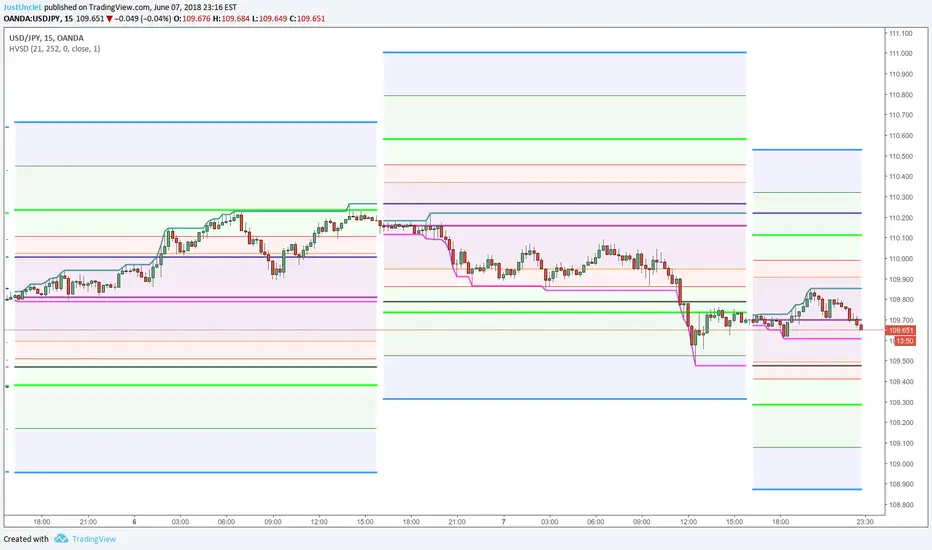
This indicator plots Daily Standard deviation levels on price chart based on Historical Volatility (HV). It uses the most common approach for calculating historical volatility as standard deviation of logarithmic returns, based on daily closing/settlement prices.
Assets: Currency Pairs, Commodities, also works on stocks, some indices.
Time Frames: 5min to 60min. This will also work on Daily Chart, by setting "DaystoExpire" to 21
Options:
References:
This indicator plots Daily Standard deviation levels on price chart based on Historical Volatility (HV). It uses the most common approach for calculating historical volatility as standard deviation of logarithmic returns, based on daily closing/settlement prices.
Assets: Currency Pairs, Commodities, also works on stocks, some indices.
Time Frames: 5min to 60min. This will also work on Daily Chart, by setting "DaystoExpire" to 21
Options:
- Use Daily Data to Calculate StdDev HV (default), otherwise use the charts Time Frame
- Lookback = number of days/periods to calculate stddev of HV (21 by default)
- Annual = number of trading days in a calender year (252 by default)
- Days to Expiry = number of days for the life of this option ( for auto calculation
this is 1 for intraday, 21 for daily and annual when chart TF used) - Settlement Source = close price by default, can use another source.
- Settlement Volume Weighted Average Length = by setting this to >1 then an average
is used for settlement. - Display ### Standard Deviation Levels = select what levels are to be displayed.
References:
- How To Use Standard Deviation In Your Trading Day: https://www.youtube.com/watch?v=i28w9HBmJdQ&feature=youtu.be
- Deviation Levels Indicator: [url= youtube.com/watch?v=EjHDNIKQH5k&feature=youtu.be]youtube.com/watch?v=EjHDNIKQH5k&feature=youtu.be
- http://www.macroption.com/historical-volatility-calculation/
- Historical Volatility based Standard Deviation_V2 by ucsgears
- Historical Volatility Strategy by Hpotter
Versionshinweise
Corrected Change of day detection for Intraday TFsCorrected -0.75 Label.
Versionshinweise
Small changes:- Changed to only display background fill for upto +/- 1 Stddev.
- Added option to Display Todays Only Levels.
Versionshinweise
...- Made changes so that it also work with Renko Charts, BUT only works well with short TF (<=5min) and brick (<=6pip).
- Added Option to display Previous Day's High Low Levels.
- Added Option to display Current Day's High Low Levels.
- Changed 0.75 level to 0.7 level.
- Shortened short title to "HVSD" for easier visual when Indicator Labels are used.
Versionshinweise
...- Modified the way displaying "Only Today" levels, now only show up within the current days price action.
Versionshinweise
Efficiency Update- Improved efficiency by reducing the number of plot lines required by adding "style=2" (Line with Breaks) to the plot options.
- Added fill colour for 2nd and 3rd Stddevs.
Versionshinweise
Minor update- Corrected no History flag "nohist" calculation, would misread the number of days of data left in the history.
Open-source Skript
Ganz im Sinne von TradingView hat dieser Autor sein/ihr Script als Open-Source veröffentlicht. Auf diese Weise können nun auch andere Trader das Script rezensieren und die Funktionalität überprüfen. Vielen Dank an den Autor! Sie können das Script kostenlos verwenden, aber eine Wiederveröffentlichung des Codes unterliegt unseren Hausregeln.
JustUncleL
Haftungsausschluss
Die Informationen und Veröffentlichungen sind nicht als Finanz-, Anlage-, Handels- oder andere Arten von Ratschlägen oder Empfehlungen gedacht, die von TradingView bereitgestellt oder gebilligt werden, und stellen diese nicht dar. Lesen Sie mehr in den Nutzungsbedingungen.