OPEN-SOURCE SCRIPT
Global vs National Index Spread RSI
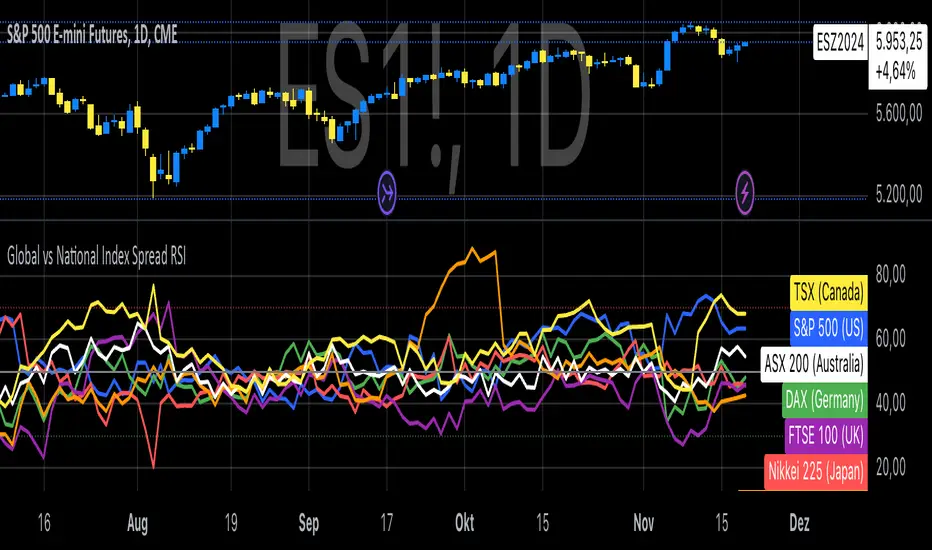
The Global vs National Index Spread RSI indicator visualizes the relative strength of national stock indices compared to a global benchmark (e.g., AMEX). It calculates the percentage spread between the closing prices of each national index and the global index, applying the Relative Strength Index (RSI) to each spread.
How It Works
Spread Calculation: The spread represents the percentage difference between a national index and the global index.
RSI Application: RSI is applied to these spreads to identify overbought or oversold conditions in the relative performance of the national indices.
Reference Lines: Overbought (70), oversold (30), and neutral (50) levels help guide interpretation.
Insights from Research
The correlation between global and national indices provides insights into market integration and interdependence. Studies such as Forbes & Rigobon (2002) emphasize the importance of understanding these linkages during periods of financial contagion. Observing spread trends with RSI can aid in identifying shifts in investor sentiment and regional performance anomalies.
Use Cases
- Detect divergences between national and global markets.
- Identify overbought or oversold conditions for specific indices.
- Complement portfolio management strategies by monitoring geographic performance.
References
Forbes, K. J., & Rigobon, R. (2002). "No contagion, only interdependence: Measuring stock market co-movements." Journal of Finance.
Eun, C. S., & Shim, S. (1989). "International transmission of stock market movements." Journal of Financial and Quantitative Analysis.
Open-source Skript
Ganz im Sinne von TradingView hat dieser Autor sein/ihr Script als Open-Source veröffentlicht. Auf diese Weise können nun auch andere Trader das Script rezensieren und die Funktionalität überprüfen. Vielen Dank an den Autor! Sie können das Script kostenlos verwenden, aber eine Wiederveröffentlichung des Codes unterliegt unseren Hausregeln.
Where others speculate, we systematize.
edgetools.org
edgetools.org
Haftungsausschluss
Die Informationen und Veröffentlichungen sind nicht als Finanz-, Anlage-, Handels- oder andere Arten von Ratschlägen oder Empfehlungen gedacht, die von TradingView bereitgestellt oder gebilligt werden, und stellen diese nicht dar. Lesen Sie mehr in den Nutzungsbedingungen.