OPEN-SOURCE SCRIPT
Exponential growth
Purpose
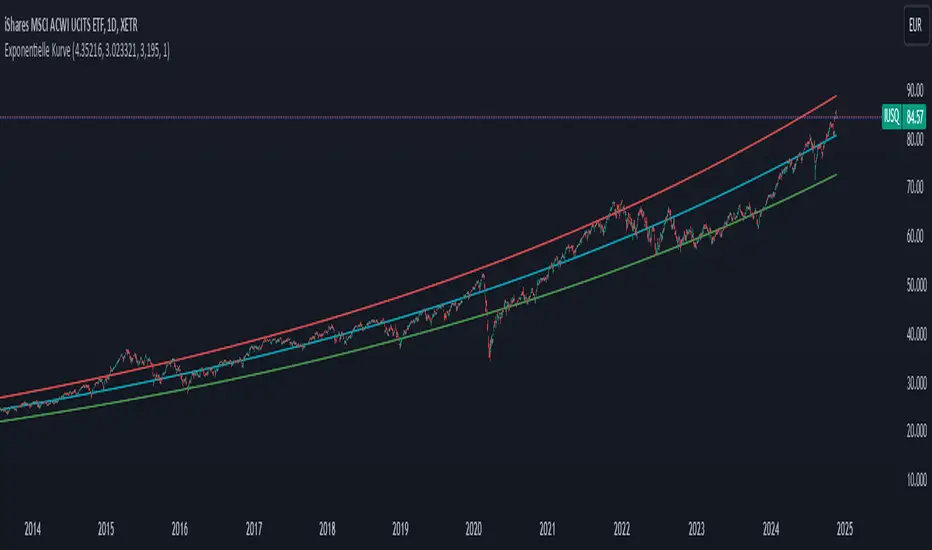
The indicator plots an exponential curve based on historical price data and supports toggling between exponential regression and linear logarithmic regression. It also provides offset bands around the curve for additional insights.
Key Inputs
1. yxlogreg and dlogreg:
These are the "Endwert" (end value) and "Startwert" (start value) for calculating the slope of the logarithmic regression.
2. bars:
Specifies how many historical bars are considered in the calculation.
3.offsetchannel:
Adds an adjustable percentage-based offset to create upper and lower bands around the main exponential curve.
Default: 1 (interpreted as 10% bands).
4.lineareregression log.:
A toggle to switch between exponential function and linear logarithmic regression.
Default: false (exponential is used by default).
5.Dynamic Labels:
Creates a label showing the calculated regression values and historical bars count at the latest bar. The label is updated dynamically.
Use Cases
Exponential Growth Tracking:
Useful for assets or instruments exhibiting exponential growth trends.
Identifying Channels:
Helps identify support and resistance levels using the offset bands.
Switching Analysis Modes:
Flexibility to toggle between exponential and linear logarithmic analysis.
Open-source Skript
Ganz im Sinne von TradingView hat dieser Autor sein/ihr Script als Open-Source veröffentlicht. Auf diese Weise können nun auch andere Trader das Script rezensieren und die Funktionalität überprüfen. Vielen Dank an den Autor! Sie können das Script kostenlos verwenden, aber eine Wiederveröffentlichung des Codes unterliegt unseren Hausregeln.
Haftungsausschluss
Die Informationen und Veröffentlichungen sind nicht als Finanz-, Anlage-, Handels- oder andere Arten von Ratschlägen oder Empfehlungen gedacht, die von TradingView bereitgestellt oder gebilligt werden, und stellen diese nicht dar. Lesen Sie mehr in den Nutzungsbedingungen.