OPEN-SOURCE SCRIPT
Aktualisiert Cross Alert with Configurable Rectangles
**Description:**
This TradingView script, **"Cross Alert with Configurable Rectangles"**, is a technical analysis tool designed to help traders visualize and analyze market trends effectively. It combines configurable moving averages with customizable timeframe-based rectangles for highlighting price ranges.
### Features:
1. **Moving Averages:**
- Calculates and plots an Exponential Moving Average (EMA) and a Simple Moving Average (SMA) based on user-defined lengths.
- Provides both short and long moving averages to identify potential trend reversals or confirmations.
2. **Customizable Timeframe Rectangles:**
- Dynamically draws rectangles around price action based on user-selected timeframes: **Hourly (60 minutes), Daily, Weekly, or Monthly.**
- Automatically updates the rectangles to reflect high and low price levels within the selected timeframe.
- Customizable rectangle color and transparency for better chart visibility.
3. **Dynamic Line Projections:**
- Projects the trend of the long and short moving averages forward in time to help anticipate price movements.
### Use Case:
This script is ideal for traders who want to:
- Identify key support and resistance levels within different timeframes.
- Analyze price behavior relative to moving averages.
- Spot potential trend changes by observing price interaction with the moving averages and timeframe rectangles.
The script is fully configurable, allowing traders to adapt it to their trading strategy and preferences.
Versionshinweise
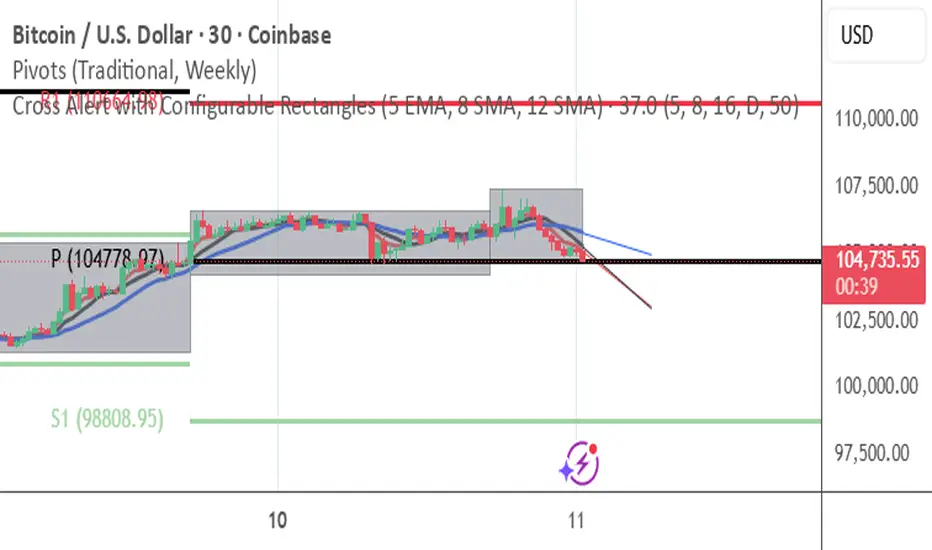
**Description for the Script (TradingView / Pine Script v5):**This TradingView indicator overlays three moving averages — a **5-period EMA**, an **8-period SMA**, and a **12-period SMA** — on the chart and visually tracks market structure using dynamic rectangles drawn for each selected timeframe (hourly, daily, weekly, or monthly).
The rectangles automatically update to highlight price ranges for the current chosen period, expanding as new highs and lows form, then resetting at each timeframe change.
In addition, the script projects short-term forward extensions of each moving average line to help visualize momentum and potential future direction.
**Core Features:**
* 5-EMA, 8-SMA, and 12-SMA displayed simultaneously for short-term and medium-term trend tracking.
* Auto-updating rectangles that outline the high-low range of each chosen timeframe (configurable between 1H, 1D, 1W, 1M).
* Customizable rectangle color and transparency.
* Forward-projected lines for all three moving averages to visualize slope and momentum.
**Intended Use:**
This tool is designed for traders who want a clean visual representation of short-term trend strength and structure boundaries, combining multiple moving averages with dynamic range mapping. It’s particularly useful for identifying trend confluence, breakout zones, and momentum shifts in real time.
Open-source Skript
Ganz im Sinne von TradingView hat dieser Autor sein/ihr Script als Open-Source veröffentlicht. Auf diese Weise können nun auch andere Trader das Script rezensieren und die Funktionalität überprüfen. Vielen Dank an den Autor! Sie können das Script kostenlos verwenden, aber eine Wiederveröffentlichung des Codes unterliegt unseren Hausregeln.
Haftungsausschluss
Die Informationen und Veröffentlichungen sind nicht als Finanz-, Anlage-, Handels- oder andere Arten von Ratschlägen oder Empfehlungen gedacht, die von TradingView bereitgestellt oder gebilligt werden, und stellen diese nicht dar. Lesen Sie mehr in den Nutzungsbedingungen.