OPEN-SOURCE SCRIPT
Aktualisiert Adaptive RSI | Lyro RS
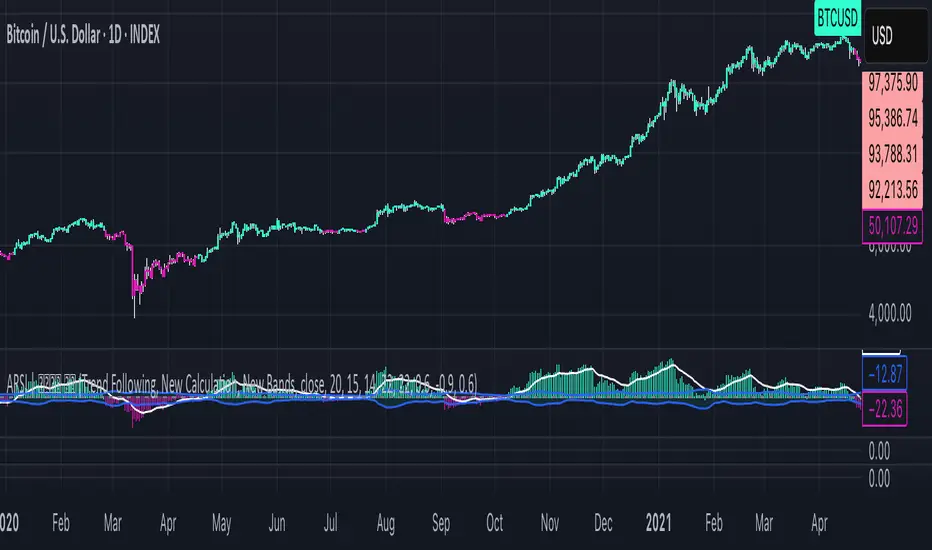
The Adaptive RSI | 𝓛𝔂𝓻𝓸 𝓡𝓢 indicator enhances the traditional Relative Strength Index (RSI) by integrating adaptive smoothing techniques and dynamic bands. This design aims to provide traders with a nuanced view of market momentum, highlighting potential trend shifts and overbought or oversold conditions.
Key Features
Customizable Color Schemes: Offers multiple predefined color palettes, including "Classic," "Mystic," "Accented," and "Royal," with an option for users to define custom colors for bullish and bearish signals.
How It Works
How to Use
Customization Options
⚠️ DISCLAIMER ⚠️: This indicator alone is not reliable and should be combined with other indicator(s) for a stronger signal.
Key Features
- Adaptive RSI Calculation: Combines fast and slow Exponential Moving Averages (EMAs) of the RSI to capture momentum shifts effectively.
- Dynamic Bands: Utilizes a smoothed standard deviation approach to create upper and lower bands around the adaptive RSI, aiding in identifying extreme market conditions.
- Signal Line: An additional EMA of the adaptive RSI serves as a signal line, assisting in confirming trend directions.
Customizable Color Schemes: Offers multiple predefined color palettes, including "Classic," "Mystic," "Accented," and "Royal," with an option for users to define custom colors for bullish and bearish signals.
How It Works
- Adaptive RSI Computation: Calculates the difference between fast and slow EMAs of the RSI, producing a responsive oscillator that adapts to market momentum.
- Band Formation: Applies a smoothing factor to the standard deviation of the adaptive RSI, generating dynamic upper and lower bands that adjust to market volatility.
- Signal Line Generation: Computes an EMA of the adaptive RSI to act as a signal line, providing additional confirmation for potential entries or exits.
- Visualization: Plots the adaptive RSI as color-coded columns, with colors indicating bullish or bearish momentum. The dynamic bands are filled to visually represent overbought and oversold zones.
How to Use
- Identify Momentum Shifts: Observe crossovers between the adaptive RSI and the signal line to detect potential changes in trend direction.
- Spot Overbought/Oversold Conditions: Monitor when the adaptive RSI approaches or breaches the dynamic bands, signaling possible market extremes.
- Customize Visuals: Select from predefined color palettes or define custom colors to align the indicator's appearance with personal preferences or chart themes.
Customization Options
- RSI and EMA Lengths: Adjust the lengths of the RSI, fast EMA, slow EMA, and signal EMA to fine-tune the indicator's sensitivity.
- Band Settings: Modify the band length, multiplier, and smoothing factor to control the responsiveness and width of the dynamic bands.
- Color Schemes: Choose from predefined color modes or enable custom color settings to personalize the indicator's appearance.
⚠️ DISCLAIMER ⚠️: This indicator alone is not reliable and should be combined with other indicator(s) for a stronger signal.
Versionshinweise
Calculation Update, input updates & more!Versionshinweise
Bug Fixes.Versionshinweise
String Option added: Rotate between old and new calculation methods, and old and new stdev bands calculations!Open-source Skript
Ganz im Sinne von TradingView hat dieser Autor sein/ihr Script als Open-Source veröffentlicht. Auf diese Weise können nun auch andere Trader das Script rezensieren und die Funktionalität überprüfen. Vielen Dank an den Autor! Sie können das Script kostenlos verwenden, aber eine Wiederveröffentlichung des Codes unterliegt unseren Hausregeln.
Get access to our private indicators & analysis: whop.com/lyro-rs
Join our community: discord.gg/YUg8UxeRu8
All material from Lyro RS is for educational purposes only. Past performance does not guarantee future results.
Join our community: discord.gg/YUg8UxeRu8
All material from Lyro RS is for educational purposes only. Past performance does not guarantee future results.
Haftungsausschluss
Die Informationen und Veröffentlichungen sind nicht als Finanz-, Anlage-, Handels- oder andere Arten von Ratschlägen oder Empfehlungen gedacht, die von TradingView bereitgestellt oder gebilligt werden, und stellen diese nicht dar. Lesen Sie mehr in den Nutzungsbedingungen.
Open-source Skript
Ganz im Sinne von TradingView hat dieser Autor sein/ihr Script als Open-Source veröffentlicht. Auf diese Weise können nun auch andere Trader das Script rezensieren und die Funktionalität überprüfen. Vielen Dank an den Autor! Sie können das Script kostenlos verwenden, aber eine Wiederveröffentlichung des Codes unterliegt unseren Hausregeln.
Get access to our private indicators & analysis: whop.com/lyro-rs
Join our community: discord.gg/YUg8UxeRu8
All material from Lyro RS is for educational purposes only. Past performance does not guarantee future results.
Join our community: discord.gg/YUg8UxeRu8
All material from Lyro RS is for educational purposes only. Past performance does not guarantee future results.
Haftungsausschluss
Die Informationen und Veröffentlichungen sind nicht als Finanz-, Anlage-, Handels- oder andere Arten von Ratschlägen oder Empfehlungen gedacht, die von TradingView bereitgestellt oder gebilligt werden, und stellen diese nicht dar. Lesen Sie mehr in den Nutzungsbedingungen.