OPEN-SOURCE SCRIPT
Aktualisiert Ichimoku Peeks
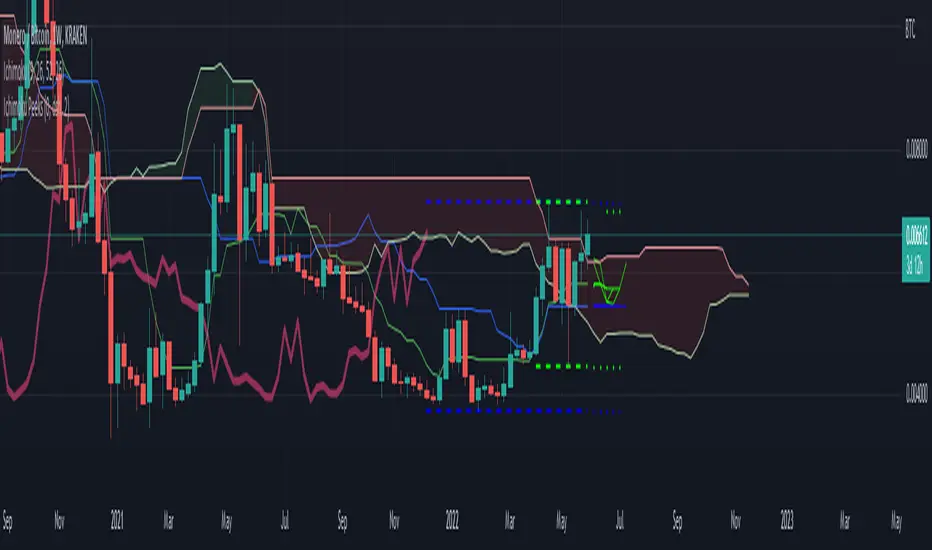
This indicator uses the Ichimoku Tenkan / Kijun trend line formulas to predict what those values will be in the future if current price action does not violate the period highs and lows.
Because of the way Ichimoku formulates the trend, it contains (but does not visualize) this predictive information in a way that moving averages do not.
Sharp chart readers can infer upcoming changes by counting back candles, but the process can be automated, as I've shown here.
This description does not seem to be editable so implementation details and usage will be covered in code commentary.
Versionshinweise
* Fixed first prediction not rendering in some configs.* Added input boundary lines to show where calculation data is pulled from (off by default).
* Minor config organization.
Versionshinweise
* Bugfix for visual artifacts. History of first projection was displayed in simple mode as infinite cross tail.* Adjusted "input boundary" diagnostic so that it more coherently relates to the projections. Now first projection drops last candle in channel.
Versionshinweise
In this update:* More code commentary about usage and theory.
* Input boundaries are now on by default and configurable.
* Input boundaries are extended by default into projected range via `Show Highs/Lows` option.
Versionshinweise
* Minor comment update to replace preview chart.Versionshinweise
Documentation and preview update.Versionshinweise
* Added built in Ichimoku via (lib-hlm)* Removed later projections due to less confidence and to make room for Ichimoku.
* Documentation updates.
* Option to fill in the boundary zones.
Open-source Skript
Ganz im Sinne von TradingView hat dieser Autor sein/ihr Script als Open-Source veröffentlicht. Auf diese Weise können nun auch andere Trader das Script rezensieren und die Funktionalität überprüfen. Vielen Dank an den Autor! Sie können das Script kostenlos verwenden, aber eine Wiederveröffentlichung des Codes unterliegt unseren Hausregeln.
Haftungsausschluss
Die Informationen und Veröffentlichungen sind nicht als Finanz-, Anlage-, Handels- oder andere Arten von Ratschlägen oder Empfehlungen gedacht, die von TradingView bereitgestellt oder gebilligt werden, und stellen diese nicht dar. Lesen Sie mehr in den Nutzungsbedingungen.