OPEN-SOURCE SCRIPT
Volatility %

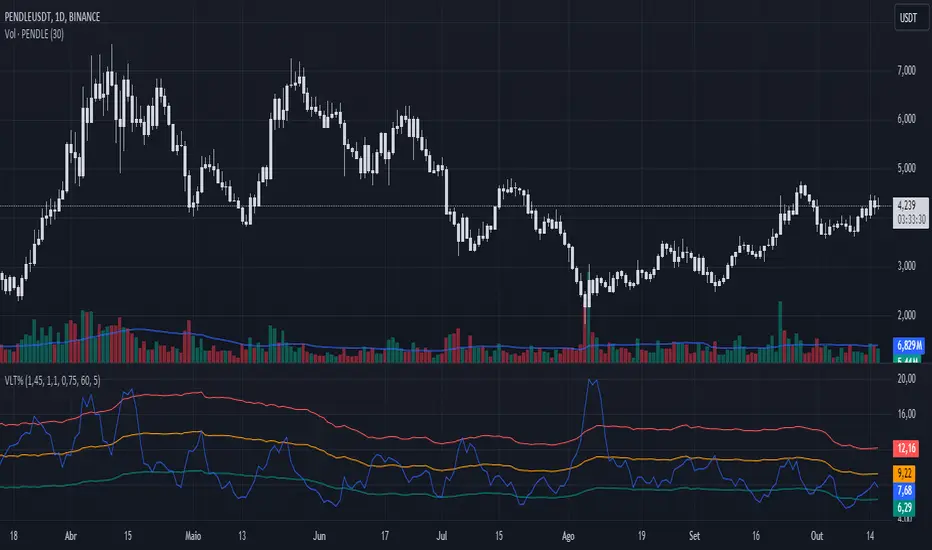
This indicator compares the average range of candles over a long period with the average range of a short period (which can be defined according to whether the strategy is more long-term or short-term), thus allowing the measurement of the asset's volatility or the strength of the movement. It was also created to be used on the 1D time frame with Swing Trading.
This indicator does not aim to predict the direction or strength of the next movement, but seeks to indicate whether the asset's value is moving more or less than the average. Based on the principle of alternation, after a large movement, there will likely be a short movement, and after a short movement, there will likely be a long one. Therefore, phases with less movement can be a good time to position oneself, and if volatility starts to decrease and the target has not been reached, closing the position can be considered.
This indicator also comes with three bands of percentage volatility averages altered by a multiplier, allowing for a dynamic reading of how volatile the market is. These should be adapted according to the asset.
This indicator is not meant to be used alone but as an auxiliary indicator.
Open-source Skript
Ganz im Sinne von TradingView hat dieser Autor sein/ihr Script als Open-Source veröffentlicht. Auf diese Weise können nun auch andere Trader das Script rezensieren und die Funktionalität überprüfen. Vielen Dank an den Autor! Sie können das Script kostenlos verwenden, aber eine Wiederveröffentlichung des Codes unterliegt unseren Hausregeln.
Haftungsausschluss
Die Informationen und Veröffentlichungen sind nicht als Finanz-, Anlage-, Handels- oder andere Arten von Ratschlägen oder Empfehlungen gedacht, die von TradingView bereitgestellt oder gebilligt werden, und stellen diese nicht dar. Lesen Sie mehr in den Nutzungsbedingungen.