OPEN-SOURCE SCRIPT
Kalman Sigmoid Z-score | SurgeQuant
Title: Kalman Sigmoid Z-score Indicator
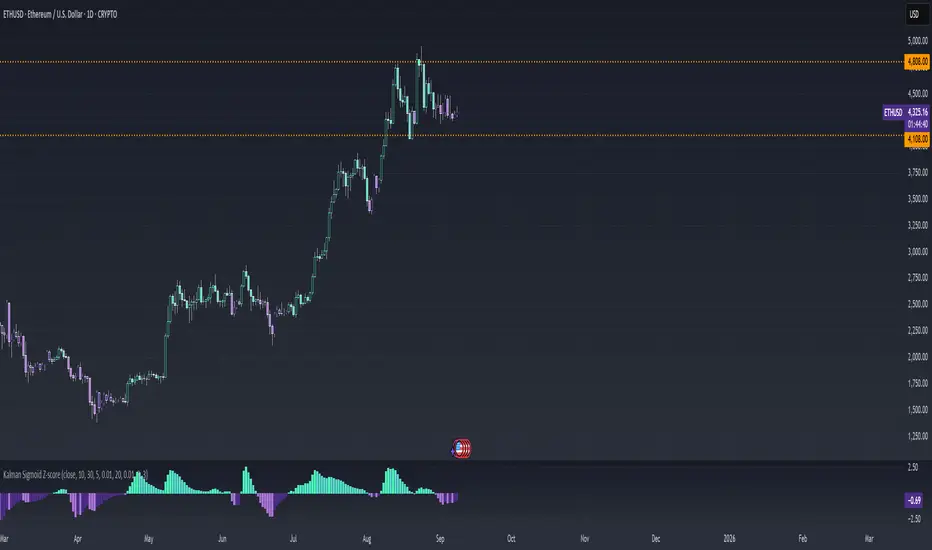
The Kalman Sigmoid Z-score indicator is a sophisticated tool designed to identify market momentum and potential trend changes using a combination of Kalman filtering, sigmoid-weighted averaging, and Z-score calculations. By processing price data through a Kalman filter and applying adaptive sigmoid weighting, this indicator provides clear visual signals for bullish and bearish market conditions. The Z-score output and price bars are dynamically colored to highlight momentum shifts, aiding traders in identifying potential trading opportunities.
How It Works
Kalman Filter Calculation
Computes a smoothed price series using a Kalman filter based on a user-selected price source (Close, High, Low, or Open) with configurable parameters for process noise, measurement noise, and filter order (default: 3).
The Kalman filter reduces noise in the price data, providing a stable foundation for further analysis.
Sigmoid-Weighted Averaging
Applies a sigmoid function to calculate adaptive weights based on price comparisons over a user-defined lookback period (default: 10).
Weights are adjusted dynamically using a volatility ratio (standard deviation over ATR) to account for market conditions, enhancing signal reliability.
Z-score Calculation
Calculates the Z-score of the Kalman-filtered price relative to a sigmoid-weighted moving average over a user-defined period (default: 20).
Bullish Signal: Triggered when the Z-score crosses above 0, indicating potential upward momentum.
Bearish Signal: Triggered when the Z-score crosses below 0, indicating potential downward momentum.
Visual Representation
The indicator provides a clear and customizable visual interface:
Z-score Histogram: Displayed as colored columns, with distinct colors for bullish (Z-score > 0) and bearish (Z-score < 0) conditions.
Bright green (#4DFFBE) for rising Z-score above 0.
Light green (#56DFCF) for falling Z-score above 0.
Dark purple (#AE75DA) for falling Z-score below 0.
Light purple (#4D2D8C) for rising Z-score below 0.
Price Bar Coloring: Synchronizes with the Z-score colors to reflect momentum on the main chart.
Reference Line: A zero line is plotted on the Z-score panel for easy reference.
Customization & Parameters
The Kalman Sigmoid Z-score indicator offers flexible parameters to suit various trading styles:
Source: Select the input price (default: Close; options: Close, High, Low, Open).
Lookback Period: Set the period for sigmoid weight calculations (default: 10).
Volatility Period: Adjust the period for volatility ratio calculation (default: 30).
Base Steepness: Control the sigmoid function’s sensitivity (default: 5).
Base Midpoint: Set the sigmoid function’s midpoint (default: 0.01).
Z-score Period: Define the period for Z-score calculation (default: 20).
Kalman Parameters:
Process Noise (default: 0.01).
Measurement Noise (default: 3).
Filter Order (default: 3).
Color Settings: Predefined colors with distinct shades for bullish and bearish states, ensuring clear visual differentiation.
Trading Applications
This indicator is versatile and can be applied across various markets and strategies:
Momentum Trading: Highlights strong bullish or bearish momentum for potential entry or exit points based on Z-score crossings.
Trend Confirmation: Use bar coloring to confirm Z-score signals with price action on the main chart.
Reversal Detection: Identify potential reversals when the Z-score crosses the zero line.
Scalping and Swing Trading: Adjust parameters (e.g., lookback, Z-score period) to suit short-term or longer-term strategies.
Final Note
The Kalman Sigmoid Z-score indicator is a powerful tool for traders seeking to leverage advanced filtering and statistical analysis for momentum and trend-based opportunities. Its combination of Kalman-filtered price smoothing, sigmoid-weighted averaging, dynamic Z-score signals, and synchronized bar coloring offers a robust framework for informed trading decisions. As with all indicators, backtest thoroughly and integrate into a comprehensive trading strategy for optimal results. This indicator is provided for educational and informational purposes and should not be considered financial advice.
Open-source Skript
Ganz im Sinne von TradingView hat dieser Autor sein/ihr Script als Open-Source veröffentlicht. Auf diese Weise können nun auch andere Trader das Script rezensieren und die Funktionalität überprüfen. Vielen Dank an den Autor! Sie können das Script kostenlos verwenden, aber eine Wiederveröffentlichung des Codes unterliegt unseren Hausregeln.
Haftungsausschluss
Die Informationen und Veröffentlichungen sind nicht als Finanz-, Anlage-, Handels- oder andere Arten von Ratschlägen oder Empfehlungen gedacht, die von TradingView bereitgestellt oder gebilligt werden, und stellen diese nicht dar. Lesen Sie mehr in den Nutzungsbedingungen.