OPEN-SOURCE SCRIPT
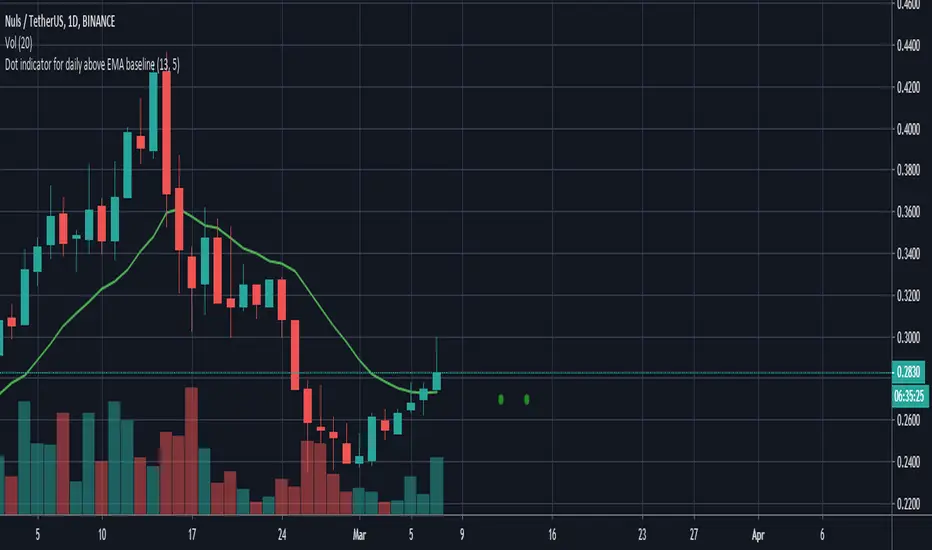
Aktualisiert Dot indicator - Daily candle opened above the daily EMA baseline
https://www.tradingview.com/x/PHTOoLHz/
//version=3
//Written by David Carruthers
//Objective
//This is to support scanning the market to check if the daily candle opened above the daily EMA baseline for a selected pair
//This can be done in some measure by using trading view's screening tools
//However it would be useful, if someone references a pair, to instantly see if that pair opened above the daily baseline regardless of what resolution you are in
//This script, works out a green dot if the pairs daily candle opened above the daily EMA baseline, and a red dot if it didn't
//It then displays a green or red dot on the open for the last candle you are looking at regardless of resolution
//This saves jumping back and forth between the daily resolution and current resolution
Note please excuse my Pine scripting I am new to it :-)
Versionshinweise
Brand new version of the Daily baseline scriptThere are now 2 x dots offset to the right
Left dot: Did the current daily candle open above the daily EMA baseline ?
Right dot: Did the latest candle in the current resolution open above the Daily EMA baseline?
This allows you to keep on an resolution, for example 1 hour, and if I see a green dot to the left and a red dot to the right, I can see that the daily candle opened above the EMA baseline, but the current hourly is below it.
Open-source Skript
Ganz im Sinne von TradingView hat dieser Autor sein/ihr Script als Open-Source veröffentlicht. Auf diese Weise können nun auch andere Trader das Script rezensieren und die Funktionalität überprüfen. Vielen Dank an den Autor! Sie können das Script kostenlos verwenden, aber eine Wiederveröffentlichung des Codes unterliegt unseren Hausregeln.
Haftungsausschluss
Die Informationen und Veröffentlichungen sind nicht als Finanz-, Anlage-, Handels- oder andere Arten von Ratschlägen oder Empfehlungen gedacht, die von TradingView bereitgestellt oder gebilligt werden, und stellen diese nicht dar. Lesen Sie mehr in den Nutzungsbedingungen.