OPEN-SOURCE SCRIPT
Daily Performance Heatmap

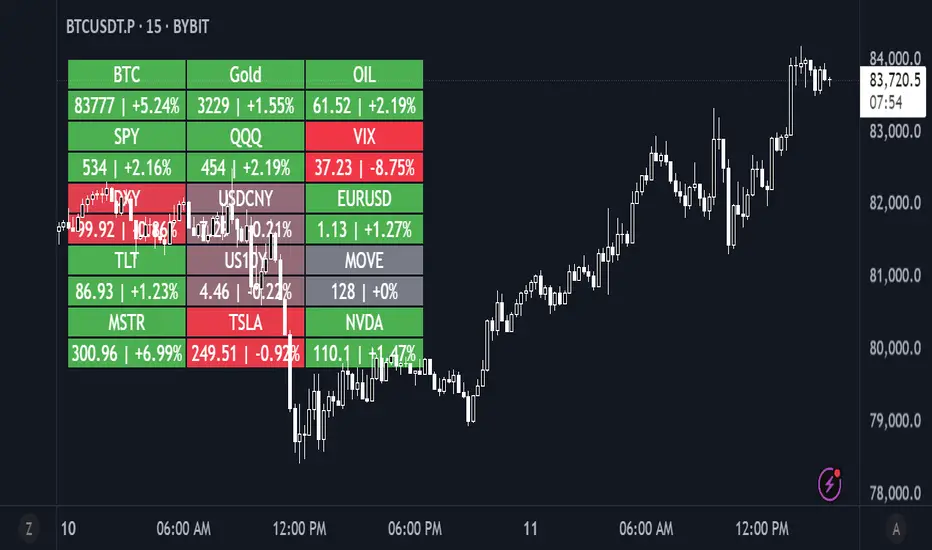
This script displays a customizable daily performance heatmap for key assets across crypto, equities, bonds, commodities, currencies, and volatility indices.
Each cell shows the current price and the percent change since the daily open, color-coded using a gradient from negative to positive. Assets are arranged in a left-to-right, top-down grid, with adjustable layout and styling.
⚙️ Features:
🔢 Displays current price and daily % change
🎨 Color-coded heatmap using customizable gradients
🧱 Adjustable layout: number of columns, cell size, and text size
🧠 Smart price formatting (no decimals for BTC, Gold, etc.)
🪟 Clean alignment with padded spacing for UI clarity
🛠️ Future plans:
User-input asset lists and labels
Category grouping and dynamic sorting
Optional icons, tooltips, or alerts
Open-source Skript
Ganz im Sinne von TradingView hat dieser Autor sein/ihr Script als Open-Source veröffentlicht. Auf diese Weise können nun auch andere Trader das Script rezensieren und die Funktionalität überprüfen. Vielen Dank an den Autor! Sie können das Script kostenlos verwenden, aber eine Wiederveröffentlichung des Codes unterliegt unseren Hausregeln.
Haftungsausschluss
Die Informationen und Veröffentlichungen sind nicht als Finanz-, Anlage-, Handels- oder andere Arten von Ratschlägen oder Empfehlungen gedacht, die von TradingView bereitgestellt oder gebilligt werden, und stellen diese nicht dar. Lesen Sie mehr in den Nutzungsbedingungen.