OPEN-SOURCE SCRIPT
Tick Time/Speed
The Tick Time/Speed indicator highlights the latest TradingView feature, Tick Charts (beta), and aims to provide a visual representation of the speed.
🔶 USAGE

1-minute chart
Unlike regular charts, where the time difference between two bars is relatively equal, the time difference between two tick bars can vary.

1T chart


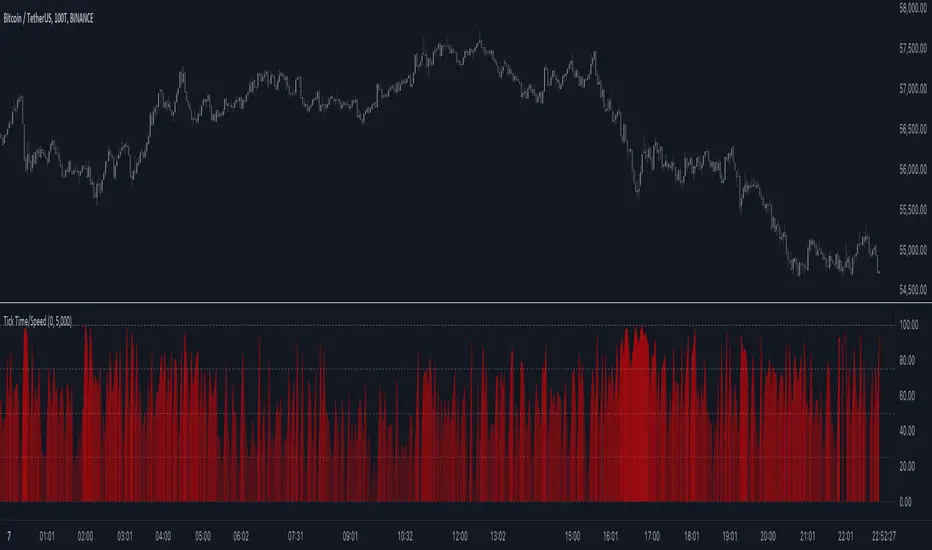
10T chart (ticks groups per 10)

100T chart (ticks groups per 100)
(zoom in to see the time scale, as can be seen in the above two examples, higher values represent more ticks in a shorter period of time)
The difference in time (speed) against previous tick(s) is added to an array and sorted. The measured speed is compared against every value in the array and then plotted.
A smaller difference in time against other ticks (more ticks in less time) is plotted higher, while a more prominent time difference is plotted at a lower level.
The amount of data (to compare with) can be set by "Calculated Bars".

The above example uses data from the last 5000, 100, and 77 bars.
🔶 SETTINGS
• Color & transparency setting
• Calculated Bars: sets the size of the array; in other words, sets the amount of available data for 'speed' comparison
🔶 NOTES
🔶 USAGE
1-minute chart
Unlike regular charts, where the time difference between two bars is relatively equal, the time difference between two tick bars can vary.
1T chart
10T chart (ticks groups per 10)
100T chart (ticks groups per 100)
(zoom in to see the time scale, as can be seen in the above two examples, higher values represent more ticks in a shorter period of time)
The difference in time (speed) against previous tick(s) is added to an array and sorted. The measured speed is compared against every value in the array and then plotted.
A smaller difference in time against other ticks (more ticks in less time) is plotted higher, while a more prominent time difference is plotted at a lower level.
The amount of data (to compare with) can be set by "Calculated Bars".
The above example uses data from the last 5000, 100, and 77 bars.
🔶 SETTINGS
• Color & transparency setting
• Calculated Bars: sets the size of the array; in other words, sets the amount of available data for 'speed' comparison
🔶 NOTES
- At this point of time, Tick Charts are only reserved for Professional-tier plans – Expert, Elite, or Ultimate plan.
- The indicator can only be used with Tick Data.
- Not all exchanges have tick data at the moment, this means not every ticker will have Tick Data.
Open-source Skript
Ganz im Sinne von TradingView hat dieser Autor sein/ihr Script als Open-Source veröffentlicht. Auf diese Weise können nun auch andere Trader das Script rezensieren und die Funktionalität überprüfen. Vielen Dank an den Autor! Sie können das Script kostenlos verwenden, aber eine Wiederveröffentlichung des Codes unterliegt unseren Hausregeln.
Who are PineCoders?
tradingview.com/chart/SSP/yW5eOqtm-Who-are-PineCoders/
TG Pine Script® Q&A: t.me/PineCodersQA
- We cannot control our emotions,
but we can control our keyboard -
tradingview.com/chart/SSP/yW5eOqtm-Who-are-PineCoders/
TG Pine Script® Q&A: t.me/PineCodersQA
- We cannot control our emotions,
but we can control our keyboard -
Haftungsausschluss
Die Informationen und Veröffentlichungen sind nicht als Finanz-, Anlage-, Handels- oder andere Arten von Ratschlägen oder Empfehlungen gedacht, die von TradingView bereitgestellt oder gebilligt werden, und stellen diese nicht dar. Lesen Sie mehr in den Nutzungsbedingungen.