OPEN-SOURCE SCRIPT
Aktualisiert Top Cap ADD%
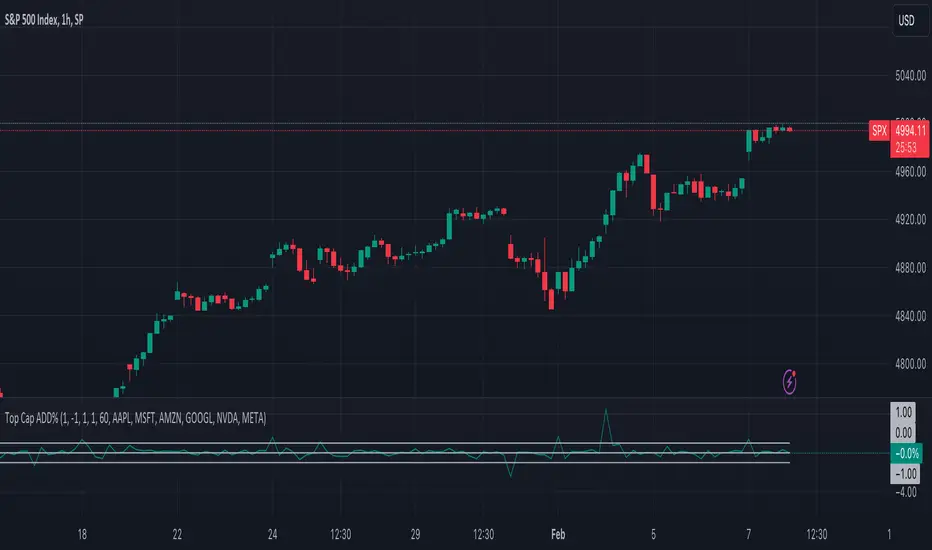
This is a very basic oscillator that plots the average % change of the top 5 highest market cap stocks in the S&P500. It can be easily modified to suit your needs on which stocks you'd like to track, and or filter out the threshold you're looking for.
Versionshinweise
This is a very basic oscillator that plots the average % change of the top 6 highest market cap stocks in the S&P500. It can be easily modified to suit your needs on which stocks you'd like to track, and or filter out the threshold you're looking for.The v2 update includes the following changes:
- Fixed a timeframe oversight, the original script forces you to the daily timeframe, you can now select the timeframe you want, this is brings much more versatility to both short term and long term traders.
- The limits are changed from integers to floats, this fixed oversight allows you to have much more control over the outliers you are looking for.
- I have also added
- Background is slightly more transparent by default for better visuals.
Open-source Skript
Ganz im Sinne von TradingView hat dieser Autor sein/ihr Script als Open-Source veröffentlicht. Auf diese Weise können nun auch andere Trader das Script rezensieren und die Funktionalität überprüfen. Vielen Dank an den Autor! Sie können das Script kostenlos verwenden, aber eine Wiederveröffentlichung des Codes unterliegt unseren Hausregeln.
Haftungsausschluss
Die Informationen und Veröffentlichungen sind nicht als Finanz-, Anlage-, Handels- oder andere Arten von Ratschlägen oder Empfehlungen gedacht, die von TradingView bereitgestellt oder gebilligt werden, und stellen diese nicht dar. Lesen Sie mehr in den Nutzungsbedingungen.