OPEN-SOURCE SCRIPT
Aktualisiert Candlestick Trailing Allocation
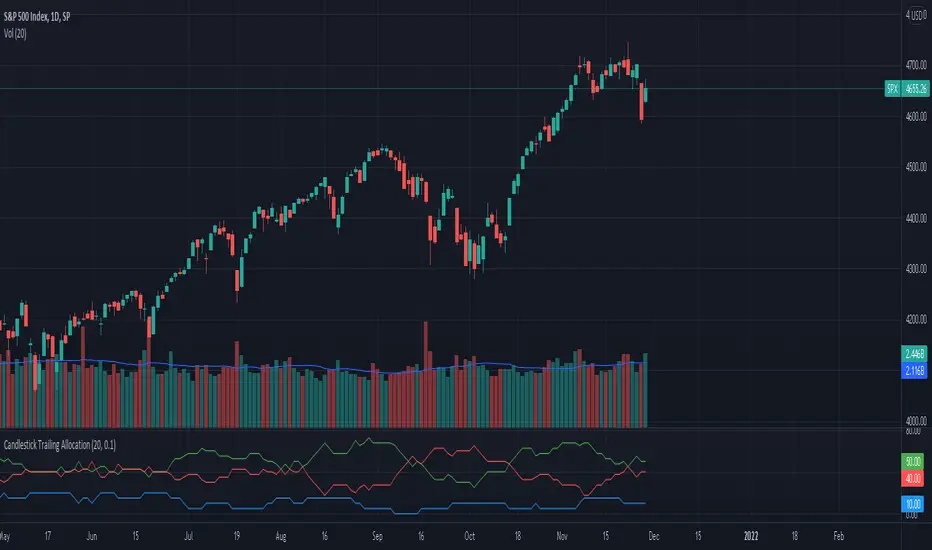
A simple indicator that calculates the sum of 'Up'(green), 'Down'(red), and 'Doji'(near Doji) candlesticks and portrays the same in an allocation format in percentage. And since it is allocation-based, the total will never exceed 100% of the defined Length period.
The equation is Green + Red + Doji = Total Candles; where total candles = length
When calculating the allocation part, the doji candles are subtracted from the sum of green and red, and the new value is divided by the length period.
For example, the green line = (sum of all green candles - doji / 2) / length; the reason to divide doji by 2 is to eliminate the redundancy it can cause.
When the green line crosses above the red line, the number of green candles is more than red in the defined length period. Similarly, when the red line crossed above the green, there were more red candles than green in that period.
The Doji line shows if any doji or near doji candles have appeared. It acts as a form of resistance against the green and red candles.
There's also the option to change the value of the doji's weight. Default is at 0.1.
The indicator does not show trend nor momentum, even though it may replicate some of its behavior from time to time. It is purely showing the allocation of the number of candles classified as green, red, and doji within the length provided.
Versionshinweise
Truncated the variables used in the source code.Open-source Skript
Ganz im Sinne von TradingView hat dieser Autor sein/ihr Script als Open-Source veröffentlicht. Auf diese Weise können nun auch andere Trader das Script rezensieren und die Funktionalität überprüfen. Vielen Dank an den Autor! Sie können das Script kostenlos verwenden, aber eine Wiederveröffentlichung des Codes unterliegt unseren Hausregeln.
Haftungsausschluss
Die Informationen und Veröffentlichungen sind nicht als Finanz-, Anlage-, Handels- oder andere Arten von Ratschlägen oder Empfehlungen gedacht, die von TradingView bereitgestellt oder gebilligt werden, und stellen diese nicht dar. Lesen Sie mehr in den Nutzungsbedingungen.
Open-source Skript
Ganz im Sinne von TradingView hat dieser Autor sein/ihr Script als Open-Source veröffentlicht. Auf diese Weise können nun auch andere Trader das Script rezensieren und die Funktionalität überprüfen. Vielen Dank an den Autor! Sie können das Script kostenlos verwenden, aber eine Wiederveröffentlichung des Codes unterliegt unseren Hausregeln.
Haftungsausschluss
Die Informationen und Veröffentlichungen sind nicht als Finanz-, Anlage-, Handels- oder andere Arten von Ratschlägen oder Empfehlungen gedacht, die von TradingView bereitgestellt oder gebilligt werden, und stellen diese nicht dar. Lesen Sie mehr in den Nutzungsbedingungen.