INVITE-ONLY SCRIPT
TDR (Trend Direction & Risk) Indicator
Aktualisiert
Introduction
The TDR (Trend Direction & Risk) Indicator combines two of my previous indicators into one. TDR helps to visually identify price trends and also measures the risk of entering a position during that trend. This indicator is a combination of Ichimoku cloud techniques, particularly the Kijun-Sen and the percentage price oscillator (PPO) to measure a risk score.
Using the TDR Indicator
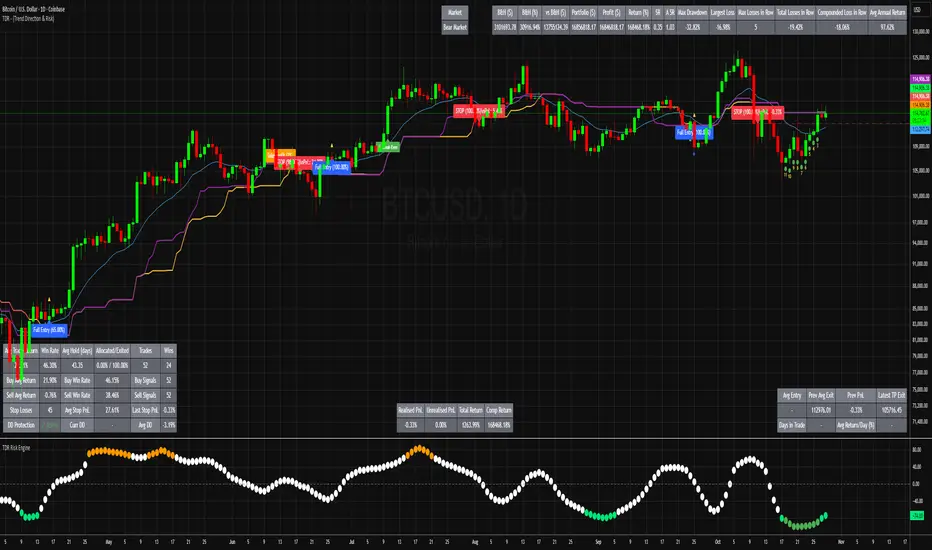
There are two main indicator lines, the blue line represents a moving average which can act as support or resistance and the orange and red line is called the trend base. When price crosses the trend base and the moving average also crosses then a change in trend direction is confirmed. This is confirmed with either a Buy or Sell signal.
In between these signals there are also Dollar Cost Average and Take Profit signals based on the current trend direction. Each of these signals gives a warning, indicated with an x above or below the candle accompanied with a b for (buy) or an (s) for sell. The next candle will display a small triangle as confirmation of this signal. These signals are based on a cross of the Advance Signal Price which is show at the current price candle.
The future base level can be set to show a larger macro trend than the current timeframe. An example of this is the 3 day timeframe which I use to determine if Bitcoin is in either a bull or bear market.
The Dollar Cost Average and Take Profit signals recommend to buy or remove a percentage of your position at these points. This percentage is completely down to personal preference.
Risk & Information Box
At the bottom right of the chart there is an information box which contains some Information. It shows the current recommended position based on the signals mentioned above. It also shows a risk score which ranges from -100 to 100. This can be used in combination with the signals and trend above for additional entry points. There are three levels, Low, Neutral and High. Buying a percentage of a position at a low risk level and selling a percentage of a position at a high risk level in combination with the trend signals is recommended.
S/R and Base Percentage
These boxes show the price percentage distance from the blue S/R line and the Trend Base Line. These larger these percentages the more likely a snap back in price towards these lines is likely. In my testing once these get above 20% or -20% the chance the price will move back towards those lines is more likely.
Users who have access to my other scripts will be given access to this one and those old ones will no longer me maintained or updated.
The TDR (Trend Direction & Risk) Indicator combines two of my previous indicators into one. TDR helps to visually identify price trends and also measures the risk of entering a position during that trend. This indicator is a combination of Ichimoku cloud techniques, particularly the Kijun-Sen and the percentage price oscillator (PPO) to measure a risk score.
Using the TDR Indicator
There are two main indicator lines, the blue line represents a moving average which can act as support or resistance and the orange and red line is called the trend base. When price crosses the trend base and the moving average also crosses then a change in trend direction is confirmed. This is confirmed with either a Buy or Sell signal.
In between these signals there are also Dollar Cost Average and Take Profit signals based on the current trend direction. Each of these signals gives a warning, indicated with an x above or below the candle accompanied with a b for (buy) or an (s) for sell. The next candle will display a small triangle as confirmation of this signal. These signals are based on a cross of the Advance Signal Price which is show at the current price candle.
The future base level can be set to show a larger macro trend than the current timeframe. An example of this is the 3 day timeframe which I use to determine if Bitcoin is in either a bull or bear market.
The Dollar Cost Average and Take Profit signals recommend to buy or remove a percentage of your position at these points. This percentage is completely down to personal preference.
Risk & Information Box
At the bottom right of the chart there is an information box which contains some Information. It shows the current recommended position based on the signals mentioned above. It also shows a risk score which ranges from -100 to 100. This can be used in combination with the signals and trend above for additional entry points. There are three levels, Low, Neutral and High. Buying a percentage of a position at a low risk level and selling a percentage of a position at a high risk level in combination with the trend signals is recommended.
S/R and Base Percentage
These boxes show the price percentage distance from the blue S/R line and the Trend Base Line. These larger these percentages the more likely a snap back in price towards these lines is likely. In my testing once these get above 20% or -20% the chance the price will move back towards those lines is more likely.
Users who have access to my other scripts will be given access to this one and those old ones will no longer me maintained or updated.
Versionshinweise
Adds a new field to the table which shows the current market condition, bull or bear market. This is calculated based on the High Timeframe Market Trend which can be changed in the settings, Default is 3Day and recommended to keep it on 3Day.Versionshinweise
Changed the descriptions for active position.Versionshinweise
Add an option to hide the Data Table on the bottom right of the chart. Show active positions as either IN or OUTVersionshinweise
Added a visual representation of the risk on the chart. When the risk level is very high it will show as a red circle above the candles and when very low a green circle below the candles.Versionshinweise
Remove most of the data from the table that is shown visually on the chart now. Show only Bull or Bear Market text instead.Versionshinweise
Added ATR indicator on current bar and added ability to set the risk zone valueSkript nur auf Einladung
Der Zugriff auf dieses Skript ist auf vom Autor autorisierte User beschränkt und normalerweise kostenpflichtig. Sie können es zu Ihren Favoriten hinzufügen, aber Sie können es nur verwenden, nachdem Sie die Erlaubnis angefordert und vom Autor erhalten haben. Kontaktieren Sie Cryptodontrading für weitere Informationen oder folgen Sie den Anweisungen des Autors unten.
TradingView empfiehlt nicht, ein Script zu kaufen, wenn Sie den Autor nicht zu 100 % als vertrauenswürdig halten, oder nicht verstehen, wie das Script funktioniert. In vielen Fällen können Sie auch eine gute und kostenlose Open-Source-Alternative in unseren Community-Scripts entdecken.
Hinweise des Autors
″This is a paid for Indicator. The learn how to get access please send me a private message and I will get back to you.
Möchten Sie dieses Skript auf einem Chart verwenden?
Warnung: Bitte lesen Sie dies, bevor Sie Zugriff anfordern.
Haftungsausschluss
Die Informationen und Veröffentlichungen sind nicht als Finanz-, Anlage-, Handels- oder andere Arten von Ratschlägen oder Empfehlungen gedacht, die von TradingView bereitgestellt oder gebilligt werden, und stellen diese nicht dar. Lesen Sie mehr in den Nutzungsbedingungen.