OPEN-SOURCE SCRIPT
Previous High/Low Range (D,W,M,Q)
Previous High/Low Range (D, W, M, Q)
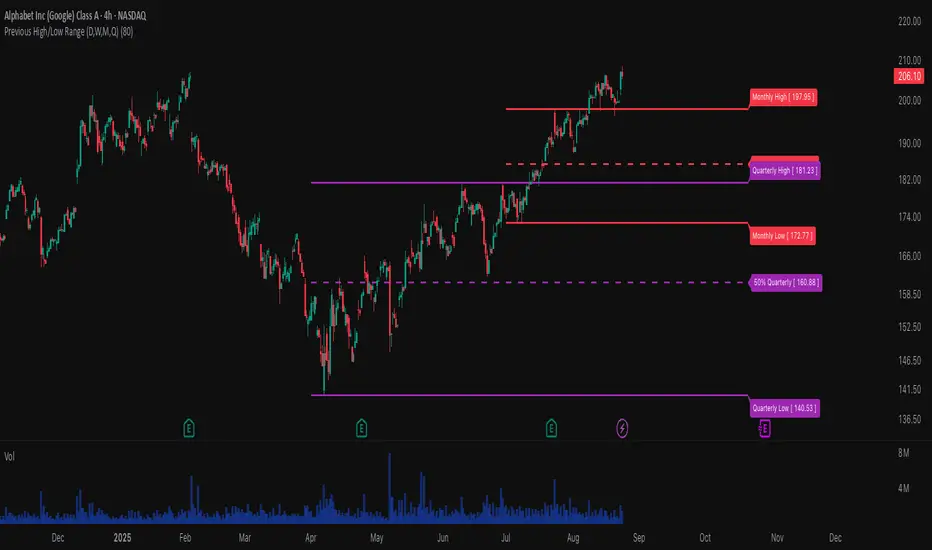
This indicator displays the previous period’s high, low, and midpoint levels across multiple timeframes: Daily, Weekly, Monthly, and Quarterly. It extends these key price levels into the future, allowing traders to quickly identify important support and resistance zones based on historical price action.
Features:
Shows previous Daily, Weekly, Monthly, and Quarterly highs, lows, and midpoints.
Optionally extends these levels forward for easy visualization.
Configurable colors and visibility for each timeframe.
Includes optional midpoint lines at 50% between high and low to identify equilibrium points.
Supports logarithmic scale calculations for midpoints to maintain accuracy on log charts.
Optional labels that display exact price values for each level.
Designed to help traders recognize key levels for entries, exits, and risk management.
Use this indicator to gain a multi-timeframe perspective on significant price ranges and anticipate potential reversal or breakout zones.
Open-source Skript
Ganz im Sinne von TradingView hat dieser Autor sein/ihr Script als Open-Source veröffentlicht. Auf diese Weise können nun auch andere Trader das Script rezensieren und die Funktionalität überprüfen. Vielen Dank an den Autor! Sie können das Script kostenlos verwenden, aber eine Wiederveröffentlichung des Codes unterliegt unseren Hausregeln.
Haftungsausschluss
Die Informationen und Veröffentlichungen sind nicht als Finanz-, Anlage-, Handels- oder andere Arten von Ratschlägen oder Empfehlungen gedacht, die von TradingView bereitgestellt oder gebilligt werden, und stellen diese nicht dar. Lesen Sie mehr in den Nutzungsbedingungen.