PROTECTED SOURCE SCRIPT
Aktualisiert January Barometer Overlay
Description:
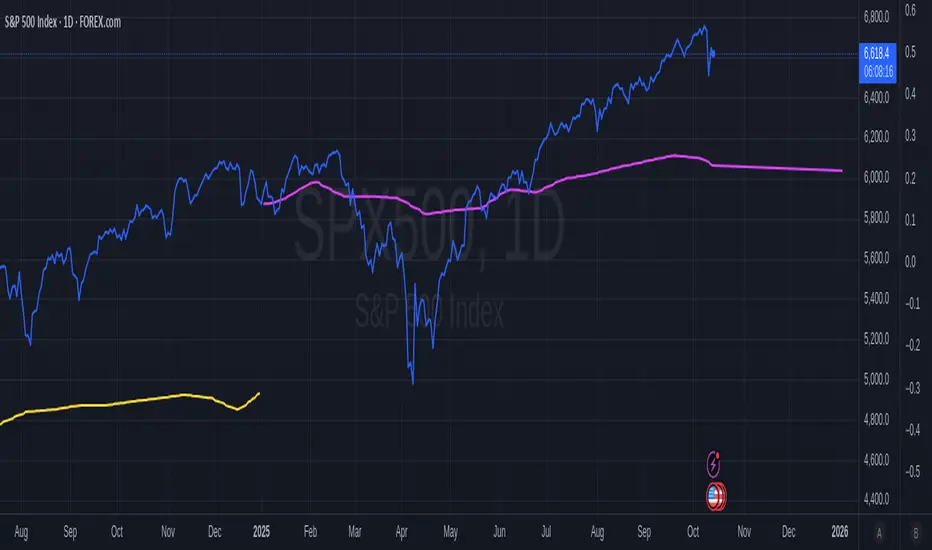
The January Barometer Overlay is a dynamic Pine Script indicator that visualizes the classic "January Barometer" seasonal forecasting concept directly on your TradingView chart. This tool stretches the intra-month price action of January (relative to its opening close) proportionally across the entire year, creating a predictive projection line that overlays your price candles. It's perfect for spotting potential yearly trends based on January's performance—e.g., if January ends up 5%, the projection forecasts a similar relative gain by December. For multi-year views, it applies a separate stretched projection for each year's January, color-coded for easy distinction: even years in hot yellow, odd years in vibrant pink. Whether you're analyzing stocks like SPY, cryptos like ETHUSD, or forex, this overlay turns historical seasonality into an intuitive, forward-looking guide. Note: It's illustrative for strategy brainstorming, not financial advice—backtest and combine with other indicators for real trades!
Key Features:
Proportional Stretching: Maps January's daily ratios to the full ~365 days (leap years handled automatically).
Future Projection: Extends the line into unloaded future bars for "what-if" forecasting.
Multi-Year Support: Alternating colors (yellow for even years, pink for odd) make historical comparisons pop.
Smooth Interpolation: Linear blending between January points for a clean, non-stepped line.
Historical Edge (S&P 500 Context): The January Barometer has ~75% directional accuracy since 1950, with positive Januaries signaling an 89% chance of yearly gains averaging +21.6%. Use it as a seasonal bias booster!
Instructions to Add and Use on TradingView
1. Search in Indicators: On any chart, click the Indicators button (fx icon) at the top. Search for "January Barometer Overlay" (or your custom title if you rename it).
2. Add to Chart: Select it from the Public Library results—Boom, it's overlaid!
Tips & Limitations:
- Works on any ticker, but shines on indices/crypto with clear seasonal patterns.
- Requires full January data; projections update live as January progresses.
- Not a guarantee—markets evolve! Test on historical data (e.g., 2020's wild January vs. actual crash). If errors pop up, ensure you're on daily bars.
Versionshinweise
Description:The January Barometer Overlay is a dynamic Pine Script indicator that visualizes the classic "January Barometer" seasonal forecasting concept directly on your TradingView chart.
I built this based on information from: brianbeamish.substack.com
"The January barometer ("As goes January, so goes the year") is the hypothesis that stock market performance in January (particularly in the U.S.) predicts its performance for the rest of the year. So if the stock market rises in January, it is likely to continue to rise by the end of December."
brianbeamish.substack.com
This tool stretches the intra-month price action of January (relative to its opening close) proportionally across the entire year, creating a predictive projection line that overlays your price candles. It's perfect for spotting potential yearly trends based on January's performance—e.g., if January ends up 5%, the projection forecasts a similar relative gain by December. For multi-year views, it applies a separate stretched projection for each year's January, color-coded for easy distinction: even years in hot yellow, odd years in vibrant pink. Whether you're analyzing stocks like SPY, cryptos like ETHUSD, or forex, this overlay turns historical seasonality into an intuitive, forward-looking guide. Note: It's illustrative for strategy brainstorming, not financial advice—backtest and combine with other indicators for real trades!Key Features:
Proportional Stretching: Maps January's daily ratios to the full ~365 days (leap years handled automatically).
Future Projection: Extends the line into unloaded future bars for "what-if" forecasting.
Multi-Year Support: Alternating colors (yellow for even years, pink for odd) make historical comparisons pop.
Smooth Interpolation: Linear blending between January points for a clean, non-stepped line.Historical Edge (S&P 500 Context): The January Barometer has ~75% directional accuracy since 1950, with positive Januaries signaling an 89% chance of yearly gains averaging +21.6%. Use it as a seasonal bias booster!Instructions to Add and Use on TradingView Search in Indicators: On any chart, click the Indicators button (fx icon) at the top. Search for "January Barometer Overlay" (or your custom title if you rename it).
Add to Chart: Select it from the Public Library results—Boom, it's overlaid!
Tips & Limitations:
- Works on any ticker, but shines on indices/crypto with clear seasonal patterns.
- Requires full January data; projections update live as January progresses.
- Not a guarantee—markets evolve! Test on historical data (e.g., 2020's wild January vs. actual crash). If errors pop up, ensure you're on daily bars.
Geschütztes Skript
Dieses Script ist als Closed-Source veröffentlicht. Sie können es kostenlos und ohne Einschränkungen verwenden – erfahren Sie hier mehr.
Haftungsausschluss
Die Informationen und Veröffentlichungen sind nicht als Finanz-, Anlage-, Handels- oder andere Arten von Ratschlägen oder Empfehlungen gedacht, die von TradingView bereitgestellt oder gebilligt werden, und stellen diese nicht dar. Lesen Sie mehr in den Nutzungsbedingungen.