OPEN-SOURCE SCRIPT
Aktualisiert GME REGIONAL PRICES OVERLAY

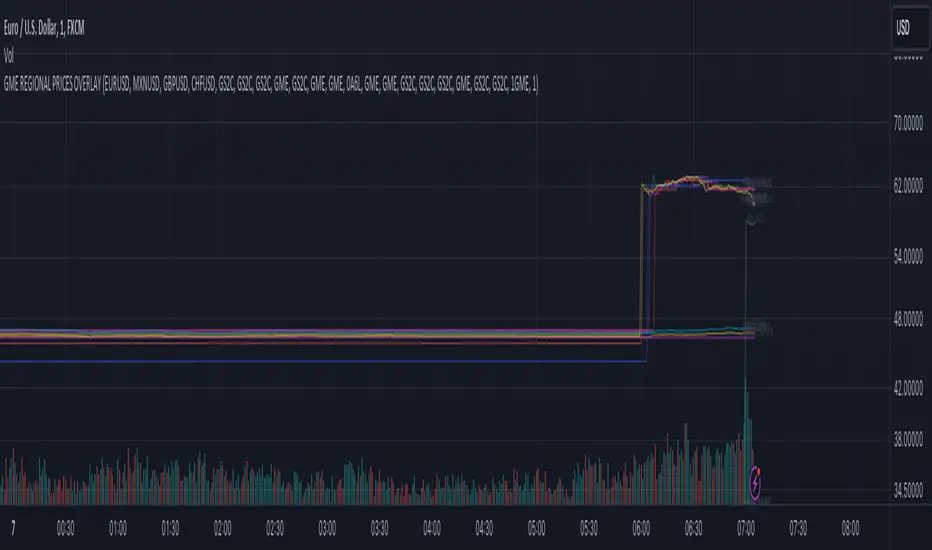
GME Regional Prices Overlay (VWAP)
1. Select a chart 24-hour ticker like FX_IDC:USDEUR
2. Select a timescale (5 min, 15 min, ...)
3. Monitor the regional price variance
Exchanges included: NYSE, XETR, BMV, FWB, SWB, BITTREX, FTX, LSE, CAPITALCOM (CFD)
Currency conversion: FX_IDC
1. Select a chart 24-hour ticker like FX_IDC:USDEUR
2. Select a timescale (5 min, 15 min, ...)
3. Monitor the regional price variance
Exchanges included: NYSE, XETR, BMV, FWB, SWB, BITTREX, FTX, LSE, CAPITALCOM (CFD)
Currency conversion: FX_IDC
Versionshinweise
GME Regional Prices Overlay1. Select a chart with around the clock ticker like FX_IDC:USDEUR
2. Select a timescale (5 min, 15 min, ...)
3. Monitor the regional price variance
Exchanges included: NYSE, XETR, BMV, FWB, SWB, MUN, PYTH, LSE, CAPITALCOM (CFD), BIVA
Currency conversion: FX_IDC
Versionshinweise
1. Select a chart with around the clock ticker like FX_IDC:USDEUR2. Select a timescale (5 min, 15 min, ...)
3. Drag the vertical price bar so that the graphs are visible
4. Monitor the regional price variance.
5. Large variance implies volatility in the short time frame (hours)
Exchanges included: NYSE, XETR, BMV, FWB, SWB, MUN, PYTH, LSE, CAPITALCOM (CFD), BIVA, BER, HAM, DUS, VIE, BX, TRADEGATE
Currency conversion: FX_IDC
Versionshinweise
1. Select a chart with around the clock ticker like FX_IDC:USDEUR2. Select a timescale (5 min, 15 min, ...)
3. Drag the screen up so the graphs are visible
Exchanges included: NYSE, XETR, BMV, FWB, SWB, MUN, PYTH, LSE, CAPITALCOM (CFD), BIVA, BER, HAM, DUS, VIE, BX, TRADEGATE
Currency conversion: FX_IDC
Versionshinweise
Updated labelsVersionshinweise
1. Select a chart with around the clock ticker like FX_IDC:USDEUR2. Select a timescale (5 min, 15 min, ...)
3. Drag the screen up so the graphs are visible
4. Monitor the regional price variance.
5. Large variance implies volatility in the short time frame (hours)
Exchanges included: NYSE, XETR, BMV, FWB, SWB, MUN, PYTH, LSIN,
CAPITALCOM (CFD), BIVA, BER, HAM, DUS, VIE,
BX, TRADEGATE, MIL
Currency conversion: FX_IDC
Versionshinweise
1. Select a chart with around the clock ticker like FX_IDC:USDEUR2. Select a timescale (5 min, 15 min, ...)
3. Drag the screen up so the graphs are visible
4. Monitor the regional price variance.
5. Large variance implies volatility in the short time frame (hours)
Exchanges included: NYSE, XETR, BMV, FWB, SWB, MUN, PYTH, LSIN,
CAPITALCOM (CFD), BIVA, BER, HAM, DUS, VIE,
BX, TRADEGATE, MIL
Currency conversion: FX_IDC
Open-source Skript
Ganz im Sinne von TradingView hat dieser Autor sein/ihr Script als Open-Source veröffentlicht. Auf diese Weise können nun auch andere Trader das Script rezensieren und die Funktionalität überprüfen. Vielen Dank an den Autor! Sie können das Script kostenlos verwenden, aber eine Wiederveröffentlichung des Codes unterliegt unseren Hausregeln.
Haftungsausschluss
Die Informationen und Veröffentlichungen sind nicht als Finanz-, Anlage-, Handels- oder andere Arten von Ratschlägen oder Empfehlungen gedacht, die von TradingView bereitgestellt oder gebilligt werden, und stellen diese nicht dar. Lesen Sie mehr in den Nutzungsbedingungen.