OPEN-SOURCE SCRIPT
Anand Bollinger Bands - Linear Regression Slope
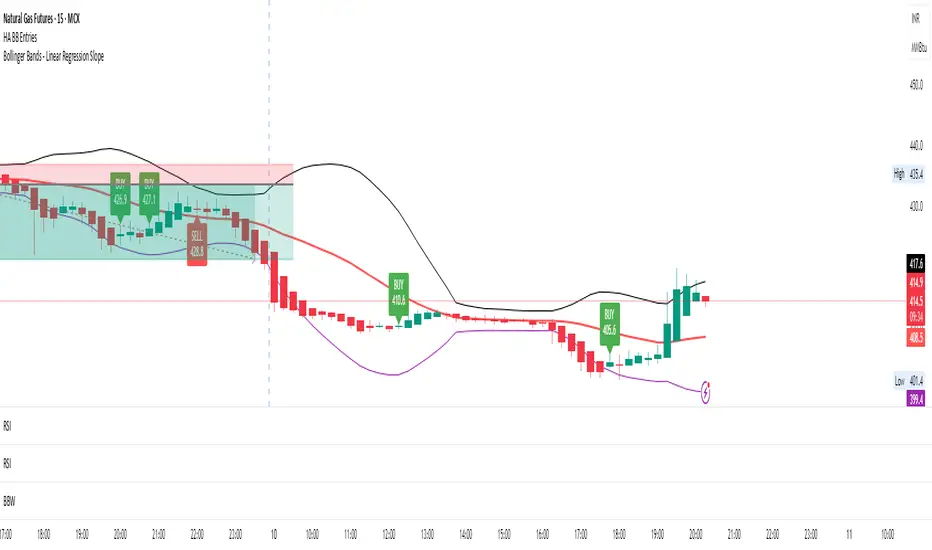
Summary
Bollinger Bands show price volatility using SMA ± standard deviation
Linear Regression calculates the mathematical trend through the middle line
Slope comparison (current vs. previous) determines if trend is rising or falling
Color changes based on that trend: Green = up, Red = down
Uses same period for both BB and slope = everything stays synchronized
The result: A visual indicator that shows you not just where price is relative to volatility, but also which direction the trend is actually moving!
Open-source Skript
Ganz im Sinne von TradingView hat dieser Autor sein/ihr Script als Open-Source veröffentlicht. Auf diese Weise können nun auch andere Trader das Script rezensieren und die Funktionalität überprüfen. Vielen Dank an den Autor! Sie können das Script kostenlos verwenden, aber eine Wiederveröffentlichung des Codes unterliegt unseren Hausregeln.
Haftungsausschluss
Die Informationen und Veröffentlichungen sind nicht als Finanz-, Anlage-, Handels- oder andere Arten von Ratschlägen oder Empfehlungen gedacht, die von TradingView bereitgestellt oder gebilligt werden, und stellen diese nicht dar. Lesen Sie mehr in den Nutzungsbedingungen.