OPEN-SOURCE SCRIPT
Aktualisiert Histogram - Price Action - Dy Calculator
This script aims to help users of Price Action robot, for Smarttbot (brazilian site that automates Brazilian market (B3)).
You can use on any symbol.
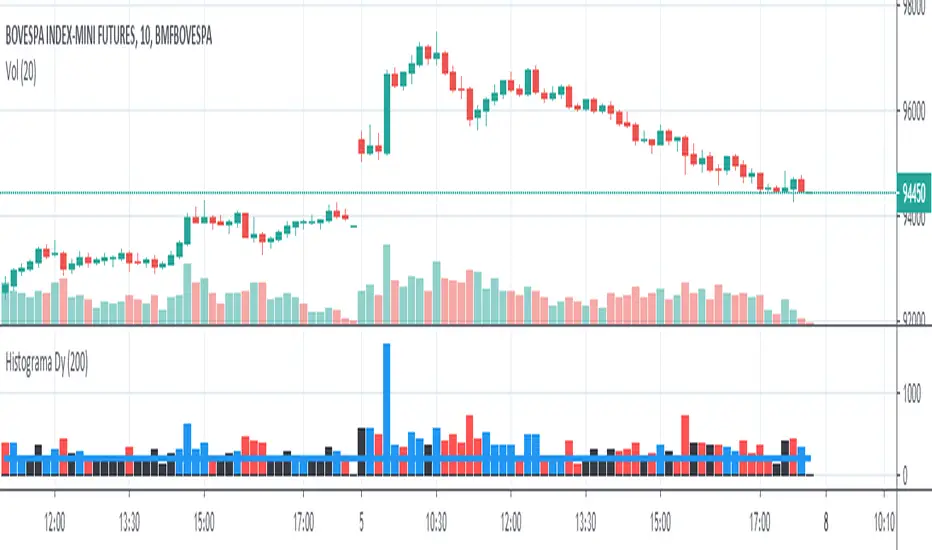
The script will follow price action principles. It will calculate the absolute value of last candle and compare with actual candle. Colors are:
- Red - If the actual candle absolute value is higher than previous one, and the price is lower than last candle. It would be a short entry.
- Blue - If the actual candle absolute value is higher than previous one, and the price is higher than last candle. It would be a long entry.
- Black - The actual candle absolute value is lower than previous one, so there is no entry.
If there is a candle that is higher than previous one, and both high and low values are outside boundaries of previous one, it will calculate which boundary is bigger and will apply the collor accordingly.
You can use on any symbol.
The script will follow price action principles. It will calculate the absolute value of last candle and compare with actual candle. Colors are:
- Red - If the actual candle absolute value is higher than previous one, and the price is lower than last candle. It would be a short entry.
- Blue - If the actual candle absolute value is higher than previous one, and the price is higher than last candle. It would be a long entry.
- Black - The actual candle absolute value is lower than previous one, so there is no entry.
If there is a candle that is higher than previous one, and both high and low values are outside boundaries of previous one, it will calculate which boundary is bigger and will apply the collor accordingly.
Versionshinweise
V4 - Better candle rupture detection, now it only marks as a rupture when last candle price (high-low) is bigger than dy and it had a rupture.Open-source Skript
Ganz im Sinne von TradingView hat dieser Autor sein/ihr Script als Open-Source veröffentlicht. Auf diese Weise können nun auch andere Trader das Script rezensieren und die Funktionalität überprüfen. Vielen Dank an den Autor! Sie können das Script kostenlos verwenden, aber eine Wiederveröffentlichung des Codes unterliegt unseren Hausregeln.
Haftungsausschluss
Die Informationen und Veröffentlichungen sind nicht als Finanz-, Anlage-, Handels- oder andere Arten von Ratschlägen oder Empfehlungen gedacht, die von TradingView bereitgestellt oder gebilligt werden, und stellen diese nicht dar. Lesen Sie mehr in den Nutzungsbedingungen.
Open-source Skript
Ganz im Sinne von TradingView hat dieser Autor sein/ihr Script als Open-Source veröffentlicht. Auf diese Weise können nun auch andere Trader das Script rezensieren und die Funktionalität überprüfen. Vielen Dank an den Autor! Sie können das Script kostenlos verwenden, aber eine Wiederveröffentlichung des Codes unterliegt unseren Hausregeln.
Haftungsausschluss
Die Informationen und Veröffentlichungen sind nicht als Finanz-, Anlage-, Handels- oder andere Arten von Ratschlägen oder Empfehlungen gedacht, die von TradingView bereitgestellt oder gebilligt werden, und stellen diese nicht dar. Lesen Sie mehr in den Nutzungsbedingungen.