OPEN-SOURCE SCRIPT
Example of Code for Moving Average Cross - Changing Colors
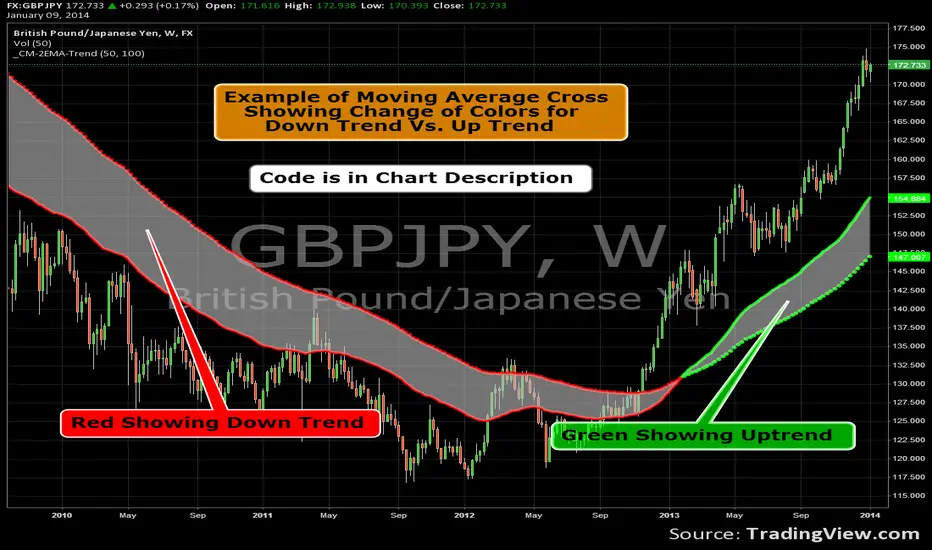
Famous 7 Time World Trading Champion Chuck Hughes found the 50 and 100 EMA to be the best Signal for a Change in Trend. Through extensive back-testing he found these EMA’s to give the earliest signal that also resulted in a Long-Term Change in Trend.
Dotted Line represents Long-Term EMA. The 100 EMA in this example.
Solid line represents the Short-Term EMA. The 50 EMA in this example.
If Short-Term EMA is ABOVE Long-Term EMA...Color = Green.
If Short-Term EMA is BELOW Long-Term EMA...Color = Red.
Dotted Line represents Long-Term EMA. The 100 EMA in this example.
Solid line represents the Short-Term EMA. The 50 EMA in this example.
If Short-Term EMA is ABOVE Long-Term EMA...Color = Green.
If Short-Term EMA is BELOW Long-Term EMA...Color = Red.
Open-source Skript
Ganz im Sinne von TradingView hat dieser Autor sein/ihr Script als Open-Source veröffentlicht. Auf diese Weise können nun auch andere Trader das Script rezensieren und die Funktionalität überprüfen. Vielen Dank an den Autor! Sie können das Script kostenlos verwenden, aber eine Wiederveröffentlichung des Codes unterliegt unseren Hausregeln.
Coming Soon: ChrisMoodyTrading.com
Haftungsausschluss
Die Informationen und Veröffentlichungen sind nicht als Finanz-, Anlage-, Handels- oder andere Arten von Ratschlägen oder Empfehlungen gedacht, die von TradingView bereitgestellt oder gebilligt werden, und stellen diese nicht dar. Lesen Sie mehr in den Nutzungsbedingungen.