INVITE-ONLY SCRIPT
Naked Put - Growth Indicator
Aktualisiert
DISCLAIMER: Do NOT follow this strategy unless you are aware of the risks of selling naked options.
1) I have identified 20 companies with 30%+ YoY revenue growth (using the most recent quarter) and minimum "average trading volume": ZEN, TEAM, BABA, SHOP, RNG, SPLK, NFLX, FB, WIX, SQ, MULE, WDAY, MU, HUBS, ABT, LOGM, NEWR, NVDA, MELI, AMZN, NOW. I like companies that fit this criteria because 30%+ revenue growth means their revenue double every ~2.5 year and their "market cap" is based on their revenue.
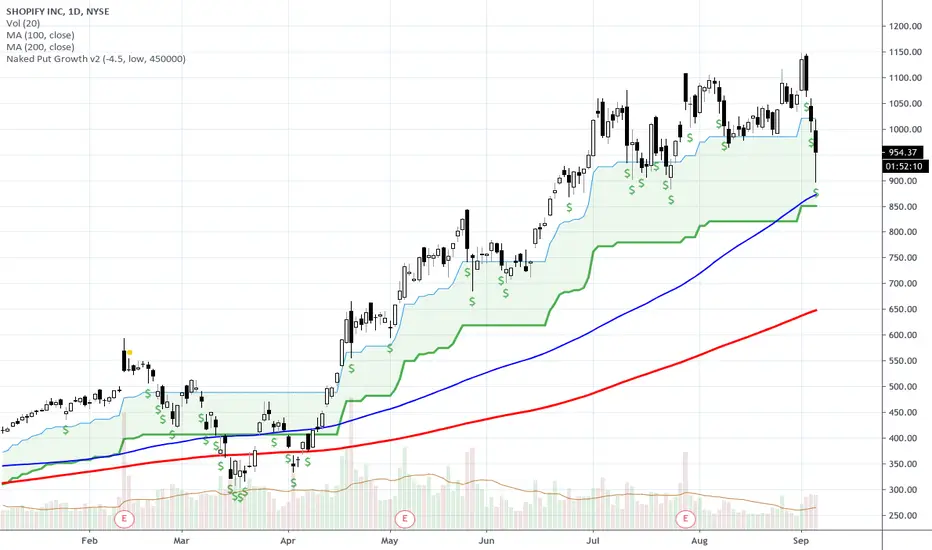
2) When you see a green "$" icon above a candle on a DAILY chart, that means it's a good time to "sell naked puts" using the solid green line as the approximate "strike price". I prefer 3-9 months until expiration and "stagger" my expirations so it's not possible for everything to be put to me all at once.
3) I use a "minimum premium" and "max contracts" that I sell that suits my risk tolerance, you will need to calculate your own contract size based on your risk tolerance.
*NOTE: This only works on a DAILY chart, and only works on the companies identified above -- if you are using intraday, weekly or monthly, the "$" signs do NOT appear.
RISK NOTE: I do NOT sell any naked puts unless I am 100% ready to own the shares AND have enough capital in my account if they are put to me, you should do the same. Don't follow this strategy unless you are prepared to OWN shares at expiration.
1) I have identified 20 companies with 30%+ YoY revenue growth (using the most recent quarter) and minimum "average trading volume": ZEN, TEAM, BABA, SHOP, RNG, SPLK, NFLX, FB, WIX, SQ, MULE, WDAY, MU, HUBS, ABT, LOGM, NEWR, NVDA, MELI, AMZN, NOW. I like companies that fit this criteria because 30%+ revenue growth means their revenue double every ~2.5 year and their "market cap" is based on their revenue.
2) When you see a green "$" icon above a candle on a DAILY chart, that means it's a good time to "sell naked puts" using the solid green line as the approximate "strike price". I prefer 3-9 months until expiration and "stagger" my expirations so it's not possible for everything to be put to me all at once.
3) I use a "minimum premium" and "max contracts" that I sell that suits my risk tolerance, you will need to calculate your own contract size based on your risk tolerance.
*NOTE: This only works on a DAILY chart, and only works on the companies identified above -- if you are using intraday, weekly or monthly, the "$" signs do NOT appear.
RISK NOTE: I do NOT sell any naked puts unless I am 100% ready to own the shares AND have enough capital in my account if they are put to me, you should do the same. Don't follow this strategy unless you are prepared to OWN shares at expiration.
Versionshinweise
added a few tweaksVersionshinweise
Changed some defaults and fix a few small bugsVersionshinweise
Jul12 2018: Fixed a few issues with the calculations..Versionshinweise
Updated version of the naked put indicator. 1. I don't hardcode any tickers anymore, got too many questions about that.
2. There is a blue line (10% pullback) & green line shaded area that draws the 10-25% pullback zone to sell premium which price action is in that zone.
3. The green line is the strike price where you sell the options.
Skript nur auf Einladung
Der Zugriff auf dieses Skript ist auf vom Autor autorisierte User beschränkt und normalerweise kostenpflichtig. Sie können es zu Ihren Favoriten hinzufügen, aber Sie können es nur verwenden, nachdem Sie die Erlaubnis angefordert und vom Autor erhalten haben. Kontaktieren Sie MattDeLong für weitere Informationen oder folgen Sie den Anweisungen des Autors unten.
TradingView empfiehlt nicht, ein Script zu kaufen, wenn Sie den Autor nicht zu 100 % als vertrauenswürdig halten, oder nicht verstehen, wie das Script funktioniert. In vielen Fällen können Sie auch eine gute und kostenlose Open-Source-Alternative in unseren Community-Scripts entdecken.
Hinweise des Autors
″
Möchten Sie dieses Skript auf einem Chart verwenden?
Warnung: Bitte lesen Sie dies, bevor Sie Zugriff anfordern.
Haftungsausschluss
Die Informationen und Veröffentlichungen sind nicht als Finanz-, Anlage-, Handels- oder andere Arten von Ratschlägen oder Empfehlungen gedacht, die von TradingView bereitgestellt oder gebilligt werden, und stellen diese nicht dar. Lesen Sie mehr in den Nutzungsbedingungen.