OPEN-SOURCE SCRIPT
Overextended vs 50DMA Detector
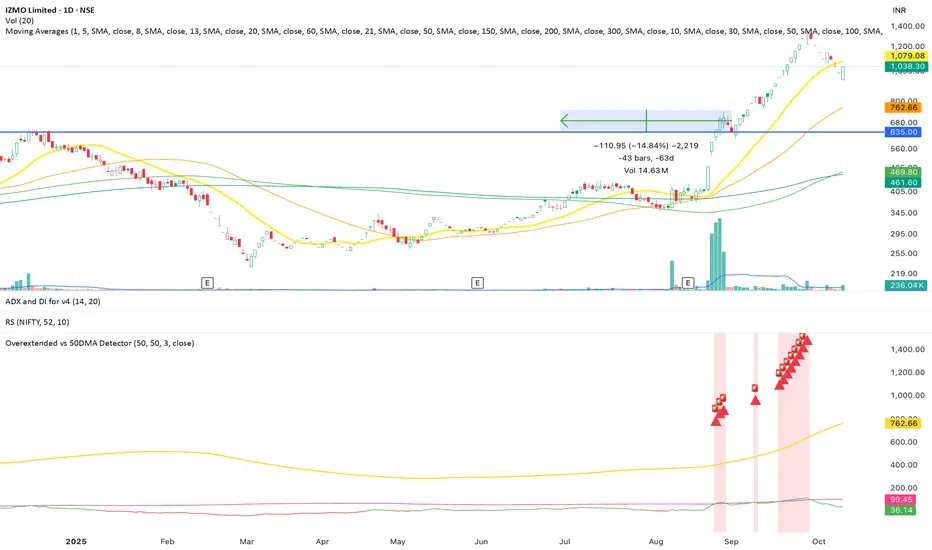
This indicator helps traders identify when a stock or asset becomes statistically overextended relative to its 50-day moving average (50DMA) — a key signal for potential pullbacks, consolidations, or profit-taking zones.
⸻
🔍 What It Does
• Calculates the 50-day simple moving average (SMA) of price.
• Computes the percentage gap between current price and the 50DMA.
• Measures the standard deviation of that percentage gap to assess volatility-adjusted extremes.
• Flags the stock as “Overextended” when:
• Price is more than 20% above the 50DMA, and
• The % gap is greater than 3× its historical standard deviation.
When these conditions are met, the script:
• Highlights the candle with a 🚨 red triangle on the chart.
• Shades the background to indicate potential overheating.
• Triggers an alert condition so traders can be notified in real time.
Open-source Skript
Ganz im Sinne von TradingView hat dieser Autor sein/ihr Script als Open-Source veröffentlicht. Auf diese Weise können nun auch andere Trader das Script rezensieren und die Funktionalität überprüfen. Vielen Dank an den Autor! Sie können das Script kostenlos verwenden, aber eine Wiederveröffentlichung des Codes unterliegt unseren Hausregeln.
Haftungsausschluss
Die Informationen und Veröffentlichungen sind nicht als Finanz-, Anlage-, Handels- oder andere Arten von Ratschlägen oder Empfehlungen gedacht, die von TradingView bereitgestellt oder gebilligt werden, und stellen diese nicht dar. Lesen Sie mehr in den Nutzungsbedingungen.