OPEN-SOURCE SCRIPT
30-Week SMA (Fixed)

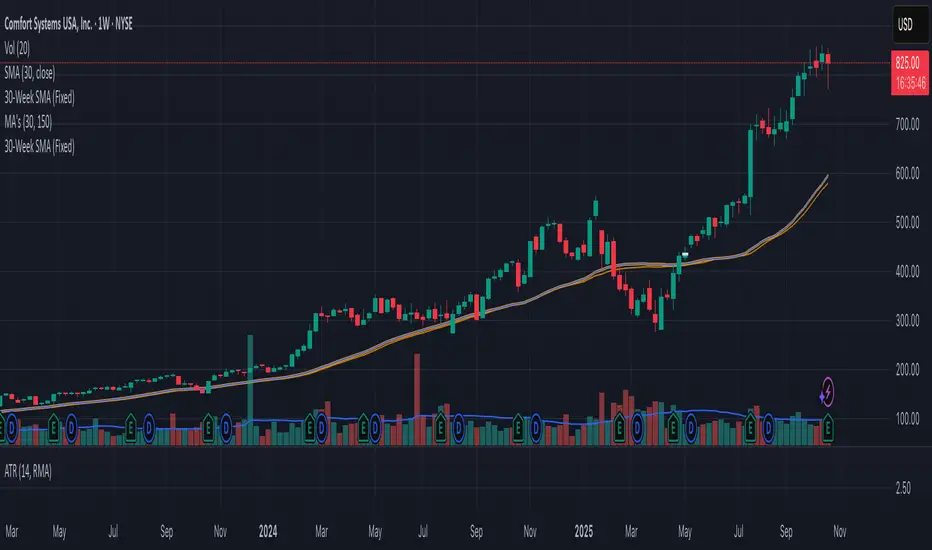
This indicator plots a true 30-week Simple Moving Average (SMA) on any chart, regardless of the selected timeframe.
It uses weekly candle data (via the request.security() function) to calculate the 30-week average and keeps it fixed — meaning the line remains accurate even when you switch to daily, 4-hour, or other timeframes.
The 30-week SMA is a cornerstone of Stan Weinstein’s Stage Analysis strategy, commonly used to identify major trend phases:
Above a rising SMA → bullish (Stage 2 uptrend)
Below a falling SMA → bearish (Stage 4 downtrend)
Use this indicator to maintain a consistent long-term trend filter on all timeframes
Open-source Skript
Ganz im Sinne von TradingView hat dieser Autor sein/ihr Script als Open-Source veröffentlicht. Auf diese Weise können nun auch andere Trader das Script rezensieren und die Funktionalität überprüfen. Vielen Dank an den Autor! Sie können das Script kostenlos verwenden, aber eine Wiederveröffentlichung des Codes unterliegt unseren Hausregeln.
Haftungsausschluss
Die Informationen und Veröffentlichungen sind nicht als Finanz-, Anlage-, Handels- oder andere Arten von Ratschlägen oder Empfehlungen gedacht, die von TradingView bereitgestellt oder gebilligt werden, und stellen diese nicht dar. Lesen Sie mehr in den Nutzungsbedingungen.