OPEN-SOURCE SCRIPT
Third-order moment by Tonymontanov
The "Third-order moment" indicator is designed to help traders identify asymmetries and potential turning points in a financial instrument's price distribution over a specified period. By calculating the skewness of the price distribution, this indicator provides insights into the potential future movement direction of the market.
User Parameters:
- Length: This parameter defines the number of bars (or periods) used to compute the mean and third-order moment. A longer length provides a broader historical context, which may smooth out short-term volatility.
- Source: The data input for calculations, defaulting to the closing price of each bar, although users can select alternatives like open, high, low, or any custom value to suit their analysis preferences.
Operational Algorithm:
1. Mean Calculation:
- The indicator begins by calculating the arithmetic mean of the selected data source over the specified period.
2. Third-order Moment Calculation:
- A deviation from the mean is calculated for each data point. These deviations are then cubed to capture any asymmetry in the price distribution.
- The third-order moment is determined by summing these cubed deviations over the specified length and dividing by the number of periods, providing a measure of skewness.
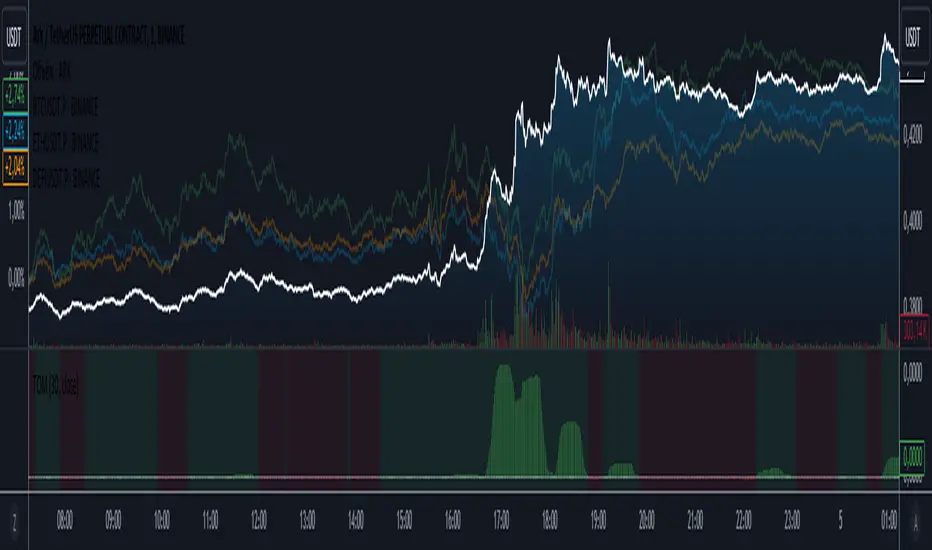
3. Graphical Representation:
- The indicator plots the third-order moment as a column plot. The color of the columns changes based on the sign of the moment: green for positive and red for negative, suggesting bullish and bearish skewness, respectively.
- A zero line is included to help visualize transitions between positive and negative skewness clearly.
- Additionally, the background color shifts depending on whether the third-order moment is above or below zero, further highlighting the prevailing market sentiment.
The "Third-order moment" indicator is a valuable tool for traders looking to gauge the market's skewness, helping identify potential trend continuations or reversals. By understanding the dominance of positive or negative skewness, traders can make more informed decisions.
User Parameters:
- Length: This parameter defines the number of bars (or periods) used to compute the mean and third-order moment. A longer length provides a broader historical context, which may smooth out short-term volatility.
- Source: The data input for calculations, defaulting to the closing price of each bar, although users can select alternatives like open, high, low, or any custom value to suit their analysis preferences.
Operational Algorithm:
1. Mean Calculation:
- The indicator begins by calculating the arithmetic mean of the selected data source over the specified period.
2. Third-order Moment Calculation:
- A deviation from the mean is calculated for each data point. These deviations are then cubed to capture any asymmetry in the price distribution.
- The third-order moment is determined by summing these cubed deviations over the specified length and dividing by the number of periods, providing a measure of skewness.
3. Graphical Representation:
- The indicator plots the third-order moment as a column plot. The color of the columns changes based on the sign of the moment: green for positive and red for negative, suggesting bullish and bearish skewness, respectively.
- A zero line is included to help visualize transitions between positive and negative skewness clearly.
- Additionally, the background color shifts depending on whether the third-order moment is above or below zero, further highlighting the prevailing market sentiment.
The "Third-order moment" indicator is a valuable tool for traders looking to gauge the market's skewness, helping identify potential trend continuations or reversals. By understanding the dominance of positive or negative skewness, traders can make more informed decisions.
Open-source Skript
Ganz im Sinne von TradingView hat dieser Autor sein/ihr Script als Open-Source veröffentlicht. Auf diese Weise können nun auch andere Trader das Script rezensieren und die Funktionalität überprüfen. Vielen Dank an den Autor! Sie können das Script kostenlos verwenden, aber eine Wiederveröffentlichung des Codes unterliegt unseren Hausregeln.
Haftungsausschluss
Die Informationen und Veröffentlichungen sind nicht als Finanz-, Anlage-, Handels- oder andere Arten von Ratschlägen oder Empfehlungen gedacht, die von TradingView bereitgestellt oder gebilligt werden, und stellen diese nicht dar. Lesen Sie mehr in den Nutzungsbedingungen.