OPEN-SOURCE SCRIPT
Delta Volume Heatmap
Delta Volume Heatmap
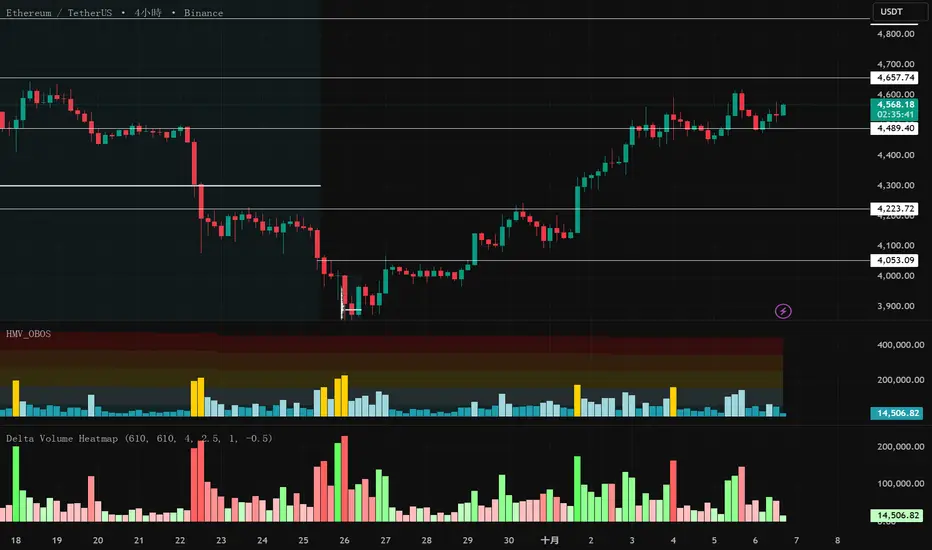
The Delta Volume Heatmap visualizes the real-time strength of per-bar delta volume — highlighting the imbalance between buying and selling pressure.
Each column’s color intensity reflects how strong the delta volume deviates from its moving average and standard deviation.
Green tones = Buy-dominant activity (bullish imbalance)
Red tones = Sell-dominant activity (bearish imbalance)
This tool helps traders quickly identify:
Abnormal volume spikes
Absorption or exhaustion zones
Potential reversal or continuation signals
Open-source Skript
Ganz im Sinne von TradingView hat dieser Autor sein/ihr Script als Open-Source veröffentlicht. Auf diese Weise können nun auch andere Trader das Script rezensieren und die Funktionalität überprüfen. Vielen Dank an den Autor! Sie können das Script kostenlos verwenden, aber eine Wiederveröffentlichung des Codes unterliegt unseren Hausregeln.
Haftungsausschluss
Die Informationen und Veröffentlichungen sind nicht als Finanz-, Anlage-, Handels- oder andere Arten von Ratschlägen oder Empfehlungen gedacht, die von TradingView bereitgestellt oder gebilligt werden, und stellen diese nicht dar. Lesen Sie mehr in den Nutzungsbedingungen.