OPEN-SOURCE SCRIPT
Aktualisiert Triple Configurable VWAP
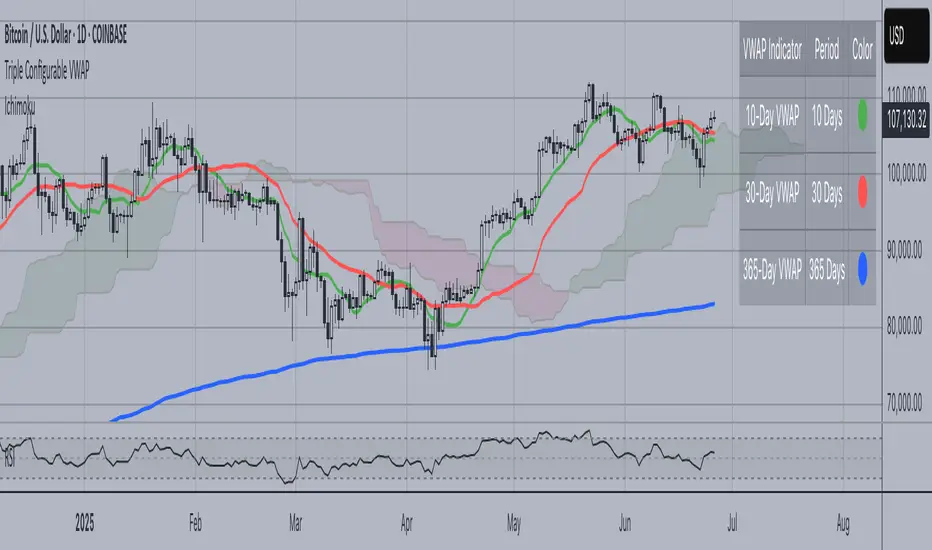
Triple Configurable VWAP Indicator
This advanced VWAP (Volume Weighted Average Price) indicator displays three independently configurable VWAP lines on your chart, providing multiple timeframe perspectives for better trading decisions.
Key Features:
• Three Customizable VWAP Periods: Configure each VWAP independently with periods ranging from 1 to 365 days
Default: 10-day (Green), 30-day (Red), 365-day (Blue)
• Dynamic Visual Elements:
Color-coded lines for easy identification
Smart labels at the current price level with matching colors
Contrasting text colors for optimal readability
• Interactive Information Table:
Toggle on/off display
Repositionable to any corner or side of the chart
Shows each VWAP period with corresponding color indicators
Larger, easy-to-read font size
• Professional Calculation Method:
Uses daily timeframe data for accurate VWAP calculations
Anchored VWAP starting from your specified lookback periods
Proper volume weighting for institutional-grade accuracy
Use Cases:
Short-term Trading: 10-day VWAP for recent price action analysis
Medium-term Analysis: 30-day VWAP for monthly trend assessment
Long-term Perspective: 365-day VWAP for yearly institutional levels
Perfect for traders who need multiple VWAP timeframes simultaneously to identify key support/resistance levels, trend direction, and institutional price points across different time horizons.
Versionshinweise
Triple Configurable VWAP IndicatorThis advanced VWAP (Volume Weighted Average Price) indicator displays three independently configurable VWAP lines on your chart, providing multiple timeframe perspectives for better trading decisions.
Key Features:
• Three Customizable VWAP Periods: Configure each VWAP independently with periods ranging from 1 to 365 days
Default: 10-day (Green), 30-day (Red), 365-day (Blue)
• Dynamic Visual Elements:
Color-coded lines for easy identification
Smart labels at the current price level with matching colors
Contrasting text colors for optimal readability
• Interactive Information Table:
Toggle on/off display
Repositionable to any corner or side of the chart
Shows each VWAP period with corresponding color indicators
Larger, easy-to-read font size
• Professional Calculation Method:
Uses daily timeframe data for accurate VWAP calculations
Anchored VWAP starting from your specified lookback periods
Proper volume weighting for institutional-grade accuracy
Use Cases:
Short-term Trading: 10-day VWAP for recent price action analysis
Medium-term Analysis: 30-day VWAP for monthly trend assessment
Long-term Perspective: 365-day VWAP for yearly institutional levels
Perfect for traders who need multiple VWAP timeframes simultaneously to identify key support/resistance levels, trend direction, and institutional price points across different time horizons.
Open-source Skript
Ganz im Sinne von TradingView hat dieser Autor sein/ihr Script als Open-Source veröffentlicht. Auf diese Weise können nun auch andere Trader das Script rezensieren und die Funktionalität überprüfen. Vielen Dank an den Autor! Sie können das Script kostenlos verwenden, aber eine Wiederveröffentlichung des Codes unterliegt unseren Hausregeln.
Find top crypto tokens with sector indices, AI-powered sentiment analysis & news summaries.
tokenradar.ai/tv
tokenradar.ai/tv
Haftungsausschluss
Die Informationen und Veröffentlichungen sind nicht als Finanz-, Anlage-, Handels- oder andere Arten von Ratschlägen oder Empfehlungen gedacht, die von TradingView bereitgestellt oder gebilligt werden, und stellen diese nicht dar. Lesen Sie mehr in den Nutzungsbedingungen.