OPEN-SOURCE SCRIPT
Aktualisiert ICT TGIF_V2 [MK]

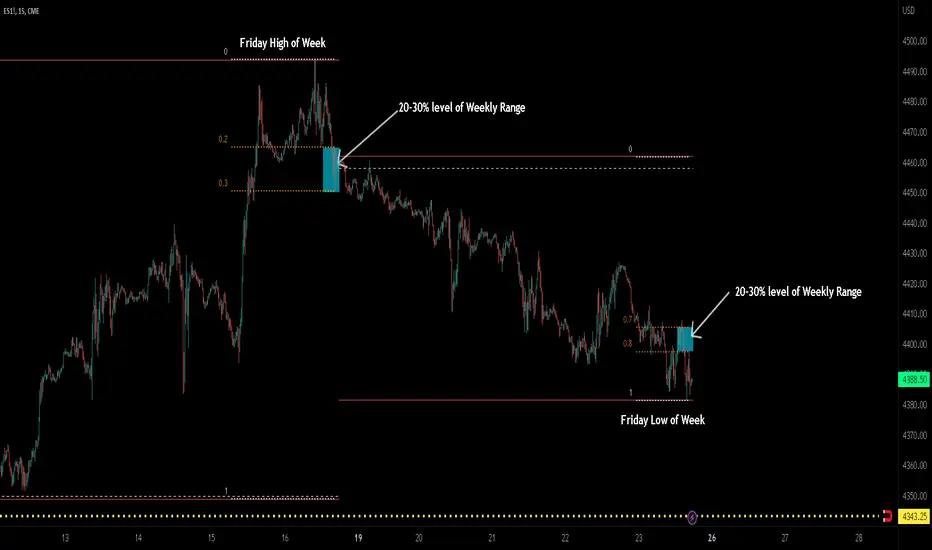
The ICT T.G.I.F (Thank God Its Friday) works on the following strategy:
1. Friday makes the High/Low of the Week.
2. The Weekly High/Low range is used to calculate 20-30% levels. (see chart above)
3. Trades are taken in the Friday PM session (NY EST) with the idea that price may retrace to the 20-30% level.
The indicator plots the following levels:
1. Week High
2. Week Low
3. Week Open
3. 20-30% level in upper part of weekly range (only shows if Friday has made the high of the week)
4. 20-30% level in lower part of weekly range (only shows if Friday has made the low of the week)
It is possible to show all historical levels listed above for the purpose of back-testing the TGIF strategy.
Also it is possible to disable all the historical and current levels, in which case only the 20-30% levels will show when Friday has made the Week High/Low (the 20-30% level only shows from 1200-1600 on Friday to keep charts as clean as possible.
Users of this script, and any script for that matter, should always do proper back-testing before taking any trades.
Many thanks should be given to ICT (The Inner Circle Trader) for bringing this strategy to the trading community.
Below shows indicator with all levels turned ON

Below shows indicator with all levels turned OFF (this allows for cleaner charts)

1. Friday makes the High/Low of the Week.
2. The Weekly High/Low range is used to calculate 20-30% levels. (see chart above)
3. Trades are taken in the Friday PM session (NY EST) with the idea that price may retrace to the 20-30% level.
The indicator plots the following levels:
1. Week High
2. Week Low
3. Week Open
3. 20-30% level in upper part of weekly range (only shows if Friday has made the high of the week)
4. 20-30% level in lower part of weekly range (only shows if Friday has made the low of the week)
It is possible to show all historical levels listed above for the purpose of back-testing the TGIF strategy.
Also it is possible to disable all the historical and current levels, in which case only the 20-30% levels will show when Friday has made the Week High/Low (the 20-30% level only shows from 1200-1600 on Friday to keep charts as clean as possible.
Users of this script, and any script for that matter, should always do proper back-testing before taking any trades.
Many thanks should be given to ICT (The Inner Circle Trader) for bringing this strategy to the trading community.
Below shows indicator with all levels turned ON
Below shows indicator with all levels turned OFF (this allows for cleaner charts)
Versionshinweise
Updated logic for TGIF box display. Previously, box would show from 0200 on Friday, now only shows from 1230 on Friday/Versionshinweise
Previously TGIF levels would only show in the Friday PM session (12:00-16:00). Now shows from 09:00 - 16:00. This time range can is also available as a user input.Versionshinweise
Bug fix with 'friday hours to show 20-30% levels'Versionshinweise
Added timezone option America/New York as default.Open-source Skript
Ganz im Sinne von TradingView hat dieser Autor sein/ihr Script als Open-Source veröffentlicht. Auf diese Weise können nun auch andere Trader das Script rezensieren und die Funktionalität überprüfen. Vielen Dank an den Autor! Sie können das Script kostenlos verwenden, aber eine Wiederveröffentlichung des Codes unterliegt unseren Hausregeln.
Haftungsausschluss
Die Informationen und Veröffentlichungen sind nicht als Finanz-, Anlage-, Handels- oder andere Arten von Ratschlägen oder Empfehlungen gedacht, die von TradingView bereitgestellt oder gebilligt werden, und stellen diese nicht dar. Lesen Sie mehr in den Nutzungsbedingungen.
Open-source Skript
Ganz im Sinne von TradingView hat dieser Autor sein/ihr Script als Open-Source veröffentlicht. Auf diese Weise können nun auch andere Trader das Script rezensieren und die Funktionalität überprüfen. Vielen Dank an den Autor! Sie können das Script kostenlos verwenden, aber eine Wiederveröffentlichung des Codes unterliegt unseren Hausregeln.
Haftungsausschluss
Die Informationen und Veröffentlichungen sind nicht als Finanz-, Anlage-, Handels- oder andere Arten von Ratschlägen oder Empfehlungen gedacht, die von TradingView bereitgestellt oder gebilligt werden, und stellen diese nicht dar. Lesen Sie mehr in den Nutzungsbedingungen.