OPEN-SOURCE SCRIPT
Aktualisiert Session stat map
Overview
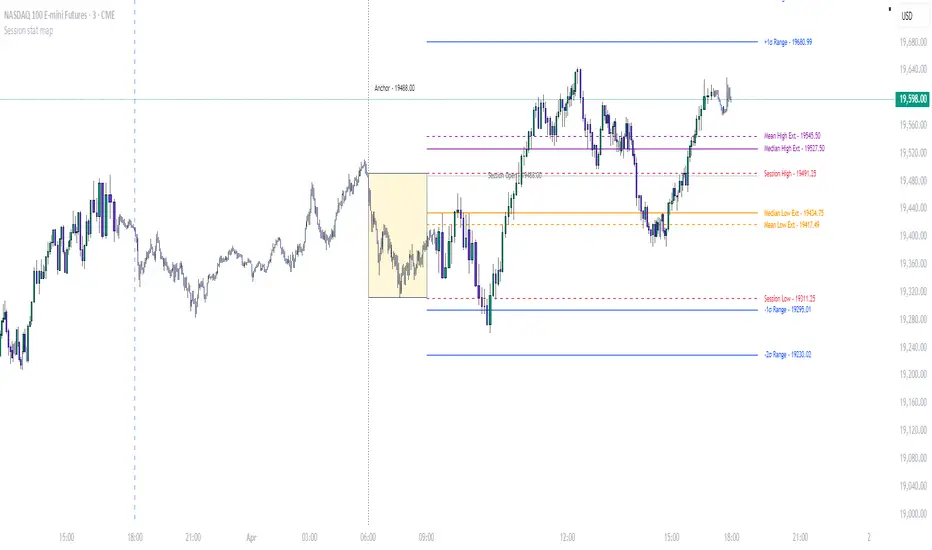
The Session Stat Map indicator is a powerful tool for traders looking to analyze pre-market price action and project key levels into the trading day. Designed as an overlay indicator, it identifies critical price zones—such as session highs/lows, standard deviation (StdDev) levels, Fibonacci retracements/extensions, and statistical extensions—based on a customizable pre-market session (default: 6:00–9:00 EST). It then tracks how often these levels are hit during a subsequent session (default: 9:00–12:00 EST), offering historical hit statistics by weekday to help you anticipate potential support, resistance, and price targets.
What It Does
Pre-Market Analysis: Captures the opening price, high, and low during a user-defined pre-market session to establish a range and key levels.
Level Projection: Extends lines for session open, high/low, StdDev levels, Fibonacci levels, and extensions into the future, making them easy to spot on your chart.
Hit Statistics: Monitors how frequently price reaches these levels during a later session, breaking down results by weekday (Monday–Friday) with hit counts, percentages, and median times-to-hit.
Visual Tools: Displays a range box for the pre-market session, an anchor line, and customizable lines/labels for each level type, plus an optional stats table.
How to Use It
Add to Chart: Install the Session Stat Map via TradingView’s Pine Editor and apply it to your chart.
Set Your Sessions: Use the input panel to define the pre-market session (e.g., 6:00–9:00 EST) for level calculation and the stats session (e.g., 9:00–12:00 EST) for tracking hits.
Interpret Levels: Watch the projected lines as potential support/resistance zones during the trading day. The range box highlights the pre-market range, while the anchor line marks the session’s starting point.
Leverage Stats: Enable the hit stats table to see which levels are hit most often, how quickly, and on which days—perfect for refining your strategy.
Trade with Confidence: Use these levels for entries, exits, stop-losses, or to gauge breakout/breakdown potential based on historical tendencies.
Input Panel Options
The indicator’s input panel lets you tailor its behaviour and appearance. Here’s what each section does:
Session Settings
Levels Session Time: Set the time window (e.g., "0600-0900" for 6:00–9:00) to analyse pre-market price action and calculate levels.
Time Zone: Choose your time zone (e.g., "America/New_York") to align session times with your market.
Stats Session Time: Define the time range (e.g., "0900-1200" for 9:00–12:00) to track how often levels are hit.
Anchor Settings
Show Session Anchor: Toggle the anchor line (drawn at the session open price).
Style, Colour, Width: Customize the anchor line’s look (e.g., dotted, black, 1px wide).
Show Anchor Label: Add a label ("Anchor") above the line.
Session Open Line Settings
Show Session Open Line: Display a line at the session’s opening price.
Style, Colour, Width: Adjust its appearance (e.g., dotted, gray, 1px wide).
Show Session Open Label: Include a "Session Open" label.
Range Box Settings
Show Range Box: Draw a box showing the pre-market high-to-low range.
Colour: Pick the box’s fill colour (e.g., semi-transparent yellow).
Range StdDev Settings
Show Range StdDev Levels: Plot lines above/below an anchor point based on standard deviation.
Style, Colour, Width: Customize these lines (e.g., solid, blue, 1px wide).
Show Labels: Add labels like "+1σ Range" or "-2σ from Low".
StdDev Level 1 & 2: Set two StdDev multipliers (e.g., 1.0 and 2.0) to define how far these levels extend (range: 0.1–5.0).
StdDev Anchor Point: Choose "Open" (session open) or "High/Low" (session extremes) as the base for StdDev calculations.
Fibonacci Settings
Show Fibonacci Levels: Display retracement levels within the pre-market range.
Colour, Style, Width: Adjust the lines (e.g., green, dashed, 1px wide).
Show Labels: Show the Fibonacci values (e.g., 0.236, 0.382).
Fib Level 1, 2, 3: Set three retracement levels (e.g., 0.236, 0.382, 0.618; range: 0–1).
Fibonacci Anchor: Base levels from either "Low" (session low) or "Open" (session open).
Fibonacci Extension Settings
Show Fibonacci Extensions: Plot extension levels beyond the pre-market range.
Colour, Style, Width: Customize the lines (e.g., teal, dashed, 1px wide).
Show Labels: Add labels like "+0.5 Range".
Fib Ext Level 1 & 2: Define two extension multipliers (e.g., 0.5 and 1.0; range: 0–5).
Session High/Low Line Settings
Show Session High/Low Lines: Draw lines at the pre-market high and low.
Style, Colour, Width: Adjust their look (e.g., dashed, red, 1px wide).
Show Labels: Include "Session High" and "Session Low" labels.
Extension Stats Settings
Show Extension Stats: Plot mean and median extension levels (above high/below low).
Extension Anchor Point: Anchor extensions to "Open" or "High/Low".
Display Settings
Projection Offset: Set how many bars forward the lines extend (e.g., 24 bars).
Label Size: Choose the size of all labels (Tiny, Small, Normal, Large).
Hit Stats Table Settings
Show Hit Stats Table: Display a table with hit counts, percentages, and median times-to-hit by weekday.
Table Position: Place the table on the chart (e.g., "Top Right").
Text Size: Adjust table text (Auto, Tiny, Small, Normal, Large, Huge).
Text Colour, Background, Frame, Border: Customize the table’s appearance.
Border Width, Frame Width: Set the thickness of the table’s borders and frame.
Tips for Traders
Tailor to Your Market: Adjust session times and time zones to fit forex, stocks, or other instruments.
Simplify the View: Toggle off unused levels to keep your chart clean.
Use Stats Wisely: Check the table to spot patterns (e.g., frequent hits on Wednesdays) and plan trades accordingly.
Experiment: Test different StdDev or Fibonacci levels to match your risk tolerance or trading style.
The Session Stat Map indicator combines pre-market analysis with actionable levels and data-driven insights, making it a versatile addition to any trader’s toolkit. Happy trading!
Versionshinweise
Updated to include price in the label for each level being plottedOpen-source Skript
Ganz im Sinne von TradingView hat dieser Autor sein/ihr Script als Open-Source veröffentlicht. Auf diese Weise können nun auch andere Trader das Script rezensieren und die Funktionalität überprüfen. Vielen Dank an den Autor! Sie können das Script kostenlos verwenden, aber eine Wiederveröffentlichung des Codes unterliegt unseren Hausregeln.
Haftungsausschluss
Die Informationen und Veröffentlichungen sind nicht als Finanz-, Anlage-, Handels- oder andere Arten von Ratschlägen oder Empfehlungen gedacht, die von TradingView bereitgestellt oder gebilligt werden, und stellen diese nicht dar. Lesen Sie mehr in den Nutzungsbedingungen.
Open-source Skript
Ganz im Sinne von TradingView hat dieser Autor sein/ihr Script als Open-Source veröffentlicht. Auf diese Weise können nun auch andere Trader das Script rezensieren und die Funktionalität überprüfen. Vielen Dank an den Autor! Sie können das Script kostenlos verwenden, aber eine Wiederveröffentlichung des Codes unterliegt unseren Hausregeln.
Haftungsausschluss
Die Informationen und Veröffentlichungen sind nicht als Finanz-, Anlage-, Handels- oder andere Arten von Ratschlägen oder Empfehlungen gedacht, die von TradingView bereitgestellt oder gebilligt werden, und stellen diese nicht dar. Lesen Sie mehr in den Nutzungsbedingungen.