PROTECTED SOURCE SCRIPT
Aktualisiert structure break indicator
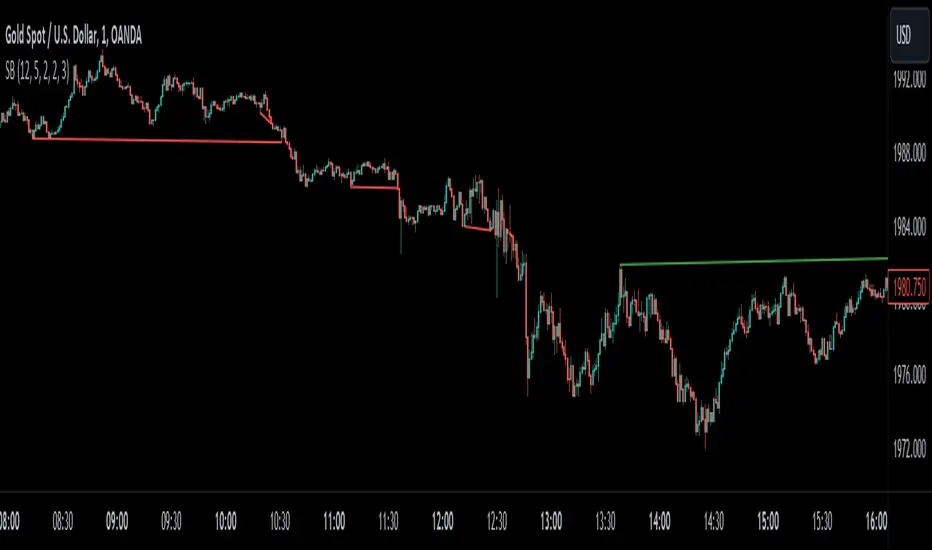
This indicator captures the beginning of a new trend or a correction. If higher highs are formed and the current low breaks the previous low, that means that a downward trend or correction is just beginning. Whereas if there are lower lows and the current high breaks the previous high, an upward trend or correction started. This uses the zigzag indicator made by DevLucem to check if highs and lows are broken or not. In the settings of this indicator you can change the colors of the lines, change the zigzag indicator's settings and choose to see the zigzag lines on your chart. Red colored lines are for bearish breaks and Green colored lines are for bullish breaks.
Versionshinweise
I changed the colors of the bearish and bullish structure breaks to make it visually easy to see. Red lines signal that a downtrend just started and green lines signal that an uptrend just startedVersionshinweise
I changed the settings for the bullish and bearish breaksVersionshinweise
I added alerts. The alert for an upward break is "🟢 Bullish break!" and "🔴 Bearish break!" for a downward break.Let me know if you want me to add something else!
Geschütztes Skript
Dieses Script ist als Closed-Source veröffentlicht. Sie können es kostenlos und ohne Einschränkungen verwenden – erfahren Sie hier mehr.
Haftungsausschluss
Die Informationen und Veröffentlichungen sind nicht als Finanz-, Anlage-, Handels- oder andere Arten von Ratschlägen oder Empfehlungen gedacht, die von TradingView bereitgestellt oder gebilligt werden, und stellen diese nicht dar. Lesen Sie mehr in den Nutzungsbedingungen.