OPEN-SOURCE SCRIPT
Blai5 Astro Indicator
The original script was posted on ProRealCode by user Nicolas.
Trend indicator based on the calculation of time on operational stockings Blai5 Vigia. Need volumes to compute correctly.
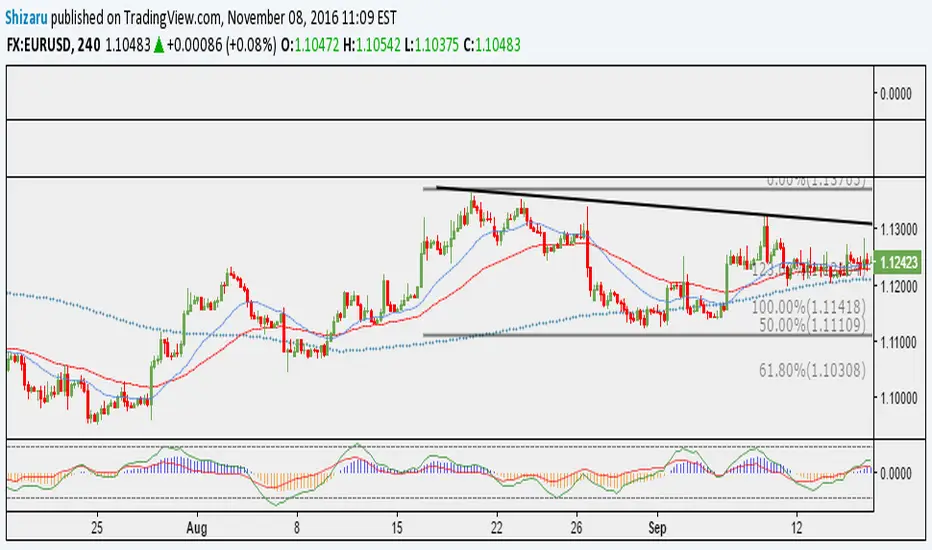
The indicator consists of three lines. The first (MR and MF) two form a ribbon that crosses regularly. Astro is the value of the difference between the two lines, and should be interpreted as we would MACD histogram.
The indicator can be configured and operated in various ways. It can be used simply making visible the Astro curve, or also presenting the "treadmill" that make up MR and MF; alone or with Astro.
Operating this trend indicator is not difficult, it gives many possibilities presenting a wealth of signs, more than the usual in this type of indicators. In principle, when MR (red) is higher than MF (blue), the time is positive and the value is likely to increase or, failing that, resist the descent; and vice versa.
It can be operated by crosses both lines (= crossings Astro on the zero line), but the most aggressive user will quickly realize that also offers the possibility to operate between extremes, slope and even by divergence, where the Astro tape is very rich.
The timing of the cycle (T) can be adjusted to better match assets and temporality wishing surgery.
Trend indicator based on the calculation of time on operational stockings Blai5 Vigia. Need volumes to compute correctly.
The indicator consists of three lines. The first (MR and MF) two form a ribbon that crosses regularly. Astro is the value of the difference between the two lines, and should be interpreted as we would MACD histogram.
The indicator can be configured and operated in various ways. It can be used simply making visible the Astro curve, or also presenting the "treadmill" that make up MR and MF; alone or with Astro.
Operating this trend indicator is not difficult, it gives many possibilities presenting a wealth of signs, more than the usual in this type of indicators. In principle, when MR (red) is higher than MF (blue), the time is positive and the value is likely to increase or, failing that, resist the descent; and vice versa.
It can be operated by crosses both lines (= crossings Astro on the zero line), but the most aggressive user will quickly realize that also offers the possibility to operate between extremes, slope and even by divergence, where the Astro tape is very rich.
The timing of the cycle (T) can be adjusted to better match assets and temporality wishing surgery.
Open-source Skript
Ganz im Sinne von TradingView hat dieser Autor sein/ihr Script als Open-Source veröffentlicht. Auf diese Weise können nun auch andere Trader das Script rezensieren und die Funktionalität überprüfen. Vielen Dank an den Autor! Sie können das Script kostenlos verwenden, aber eine Wiederveröffentlichung des Codes unterliegt unseren Hausregeln.
Haftungsausschluss
Die Informationen und Veröffentlichungen sind nicht als Finanz-, Anlage-, Handels- oder andere Arten von Ratschlägen oder Empfehlungen gedacht, die von TradingView bereitgestellt oder gebilligt werden, und stellen diese nicht dar. Lesen Sie mehr in den Nutzungsbedingungen.