OPEN-SOURCE SCRIPT
Multiasset MVRVZ - MVRVZ for Multiple Crypto Assets [Da_Prof]
This indicator shows the Market Value-Realized Value Z-score (MVRVZ) for Multiple Assets. The MVRV-Z score measures the value of a crypto asset by comparing its market cap to the realized value and dividing by the standard deviation of the market cap (market cap – realized cap) / stdev(market cap) to get a z-score. When the market value is significantly higher than the realized value, the asset may be considered "overvalued". Conversely, market values below the realized value may indicate the asset is "undervalued". For some assets (e.g., BTC) historically high values have generally signaled price tops and historically low values have signaled bottoms.
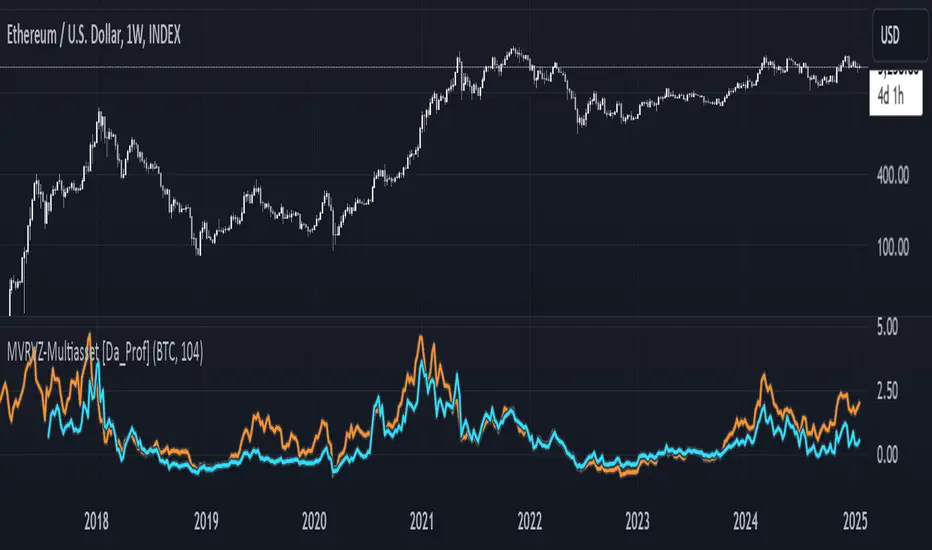
The indicator displays two lines: 1) the MVRV-Z of the current chart symbol if the data is available through Coin Metrics (this is displayed in light blue), and 2) the MVRV-Z of the symbol selected from the dropdown (displayed in orange). The MVRV-Z of BTC is the default selected orange line. The example chart shows ETH's MVRV-Z in blue and
  BTC's MVRV-Z in orange.
The MVRV-Z in this indicator is calculated on the weekly and will display consistently on lower timeframes. Some MVRV-Z indicators calculate this value from collection of all data from the beginning of the chart on the timeframe of the chart. This creates inconsistency in the standard deviation calculation and ultimately the z-score calculation when moving between time frames. This indicator calculates MVRV-Z based on the set number of weeks prior from the source data directly (default is two years worth of weekly data). This allows consistent MVRV-Z values on weekly and lower timeframes.
The indicator displays two lines: 1) the MVRV-Z of the current chart symbol if the data is available through Coin Metrics (this is displayed in light blue), and 2) the MVRV-Z of the symbol selected from the dropdown (displayed in orange). The MVRV-Z of BTC is the default selected orange line. The example chart shows
The MVRV-Z in this indicator is calculated on the weekly and will display consistently on lower timeframes. Some MVRV-Z indicators calculate this value from collection of all data from the beginning of the chart on the timeframe of the chart. This creates inconsistency in the standard deviation calculation and ultimately the z-score calculation when moving between time frames. This indicator calculates MVRV-Z based on the set number of weeks prior from the source data directly (default is two years worth of weekly data). This allows consistent MVRV-Z values on weekly and lower timeframes.
Open-source Skript
Ganz im Sinne von TradingView hat dieser Autor sein/ihr Script als Open-Source veröffentlicht. Auf diese Weise können nun auch andere Trader das Script rezensieren und die Funktionalität überprüfen. Vielen Dank an den Autor! Sie können das Script kostenlos verwenden, aber eine Wiederveröffentlichung des Codes unterliegt unseren Hausregeln.
Haftungsausschluss
Die Informationen und Veröffentlichungen sind nicht als Finanz-, Anlage-, Handels- oder andere Arten von Ratschlägen oder Empfehlungen gedacht, die von TradingView bereitgestellt oder gebilligt werden, und stellen diese nicht dar. Lesen Sie mehr in den Nutzungsbedingungen.