OPEN-SOURCE SCRIPT
Finnie's RSI Waves + Volume Colored Candles
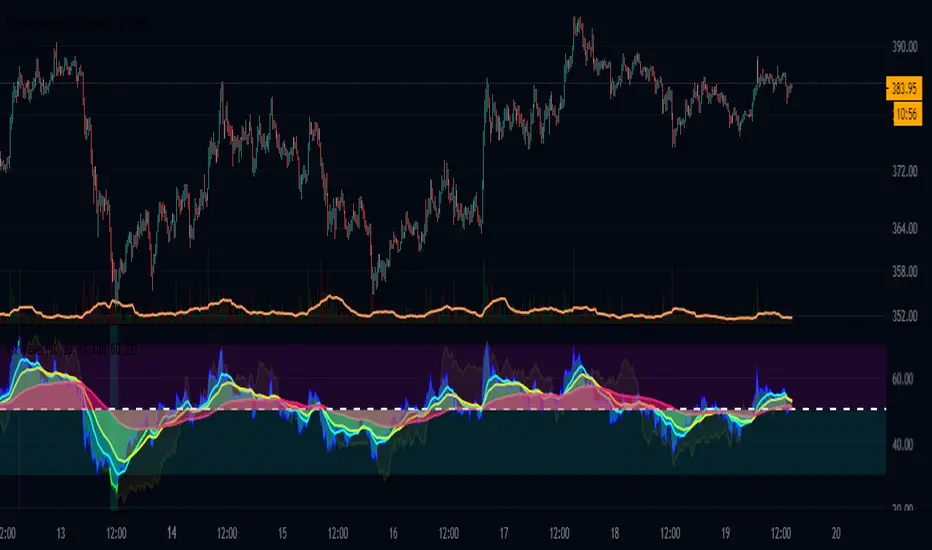
Using RSI and 4 exponential moving averages, I created this indicator so that you can spot inconsistencies between price action and RSI. There's a lot of misunderstanding surrounding RSI, most people think if something's 'oversold' buying is a guarantee win. This definitely isn't the case as there's many more variable to consider. In addition, with this indicator, candles are colored based off of volume.
INDICATOR USE:
1. Determine trend
2. Find relative support/resistance
3. Once at support/resistance look for entries:
-RSI crossing over the Short EMA (CYAN) is your fist buy/sell signal
-Short EMA (CYAN) crossing Medium EMA (YELLOW) is your second
-RSI crossing Long EMA (PINK) is your final and most accurate signal
4. Once you've made an entry, you can follow step 3. in reverse for an exit
COLORED CANDLES:
Dark Green candles = Strong Bullish volume
Light Green = Average Bullish volume
Dark Red candles = Strong Bearish volume
Light Red = Average Bearish Volume
Orange/blue means volume is conflicting with price action
I plan to add a Colored DOT over each crossover as a visual buy/sell signal if anyone has any suggestions that'd be great :)
Open-source Skript
Ganz im Sinne von TradingView hat dieser Autor sein/ihr Script als Open-Source veröffentlicht. Auf diese Weise können nun auch andere Trader das Script rezensieren und die Funktionalität überprüfen. Vielen Dank an den Autor! Sie können das Script kostenlos verwenden, aber eine Wiederveröffentlichung des Codes unterliegt unseren Hausregeln.
Haftungsausschluss
Die Informationen und Veröffentlichungen sind nicht als Finanz-, Anlage-, Handels- oder andere Arten von Ratschlägen oder Empfehlungen gedacht, die von TradingView bereitgestellt oder gebilligt werden, und stellen diese nicht dar. Lesen Sie mehr in den Nutzungsbedingungen.