OPEN-SOURCE SCRIPT
Cumulative Ease of Movement
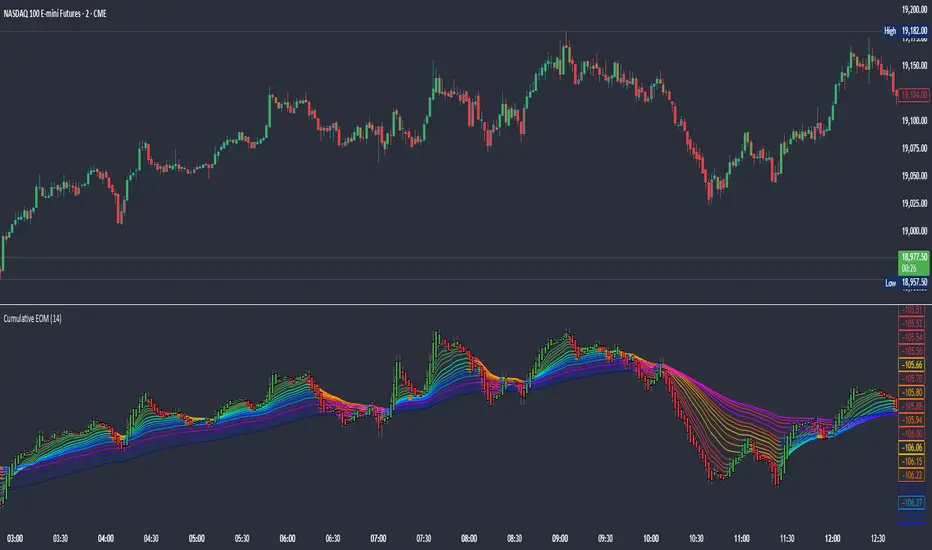
This indicator visualizes Cumulative Ease of Movement (EOM) to assess the efficiency of price movement relative to volume and volatility. Instead of analysing individual bars, this tool accumulates EOM values over time, helping you identify persistent buying or selling pressure.
The original Ease of Movement created by Richard Arms is an oscillator:
EOM = ((Midpoint Move) / Box Ratio)
Midpoint Move = ((High + Low)/2) - ((High[1] + Low[1])/2)
Box Ratio = Volume / (High - Low)
this indicator simply accumulates those values over time.
It incorporates a full Guppy Multiple Moving Average (GMMA) framework applied to the cumulative EOM curve, highlighting trend strength, transition zones, and slow/fast compression. Optional bar colouring and candle overlays reflect EOM direction and allow visual clarity during trending or congested conditions.
To facilitate the interpretation of the cumulative EOM, the GMMA and the Heikin Ashi smooths the signals, but the EOM itself is not smoothed.
Features
- Cumulative EOM plot (toggleable)
- GMMA overlays: short, medium, long-term
- Optional bar colouring based on EOM trend
- Heikin Ashi-style smoothing option
- EOM rendered as candle plot for momentum interpretation
Use Cases
- Identify trend strength and consistency through EOM slope + GMMA expansion
- Spot absorption and exhaustion zones when price pushes but cumulative EOM diverges
- Detect transitions when GMMA layers begin to compress and flip
- Validate breakout efficiency with strong EOM continuation
The Cumulative Ease of Movement (EOM) is designed to help traders follow the path of least resistance in the market by tracking whether price is moving efficiently with or against volume over time.
Rather than focusing on isolated bar-by-bar effort, it accumulates directional bias, allowing you to see whether buying or selling pressure is sustained and aligned with ease — or whether market moves are inefficient and likely to fade.
If you do not wish to use candles, or heikin ashi, you can enable the Cumulative EOM line and disable the candles.
Open-source Skript
Ganz im Sinne von TradingView hat dieser Autor sein/ihr Script als Open-Source veröffentlicht. Auf diese Weise können nun auch andere Trader das Script rezensieren und die Funktionalität überprüfen. Vielen Dank an den Autor! Sie können das Script kostenlos verwenden, aber eine Wiederveröffentlichung des Codes unterliegt unseren Hausregeln.
Haftungsausschluss
Die Informationen und Veröffentlichungen sind nicht als Finanz-, Anlage-, Handels- oder andere Arten von Ratschlägen oder Empfehlungen gedacht, die von TradingView bereitgestellt oder gebilligt werden, und stellen diese nicht dar. Lesen Sie mehr in den Nutzungsbedingungen.