OPEN-SOURCE SCRIPT
DEVPRO Trading
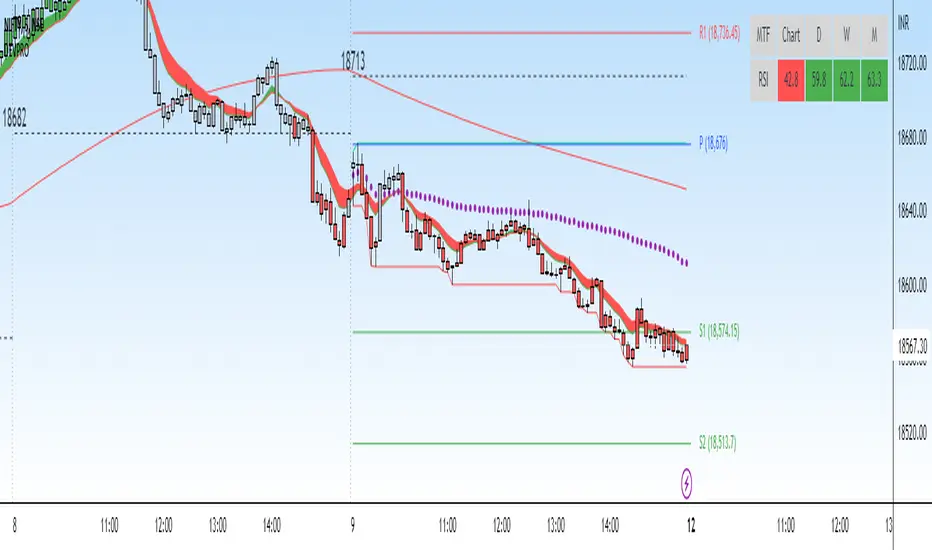
DEVPRO Trading system comprises of the following:
D - Double (EMA and VWAP)
E - EMA
V - VWAP (current and previous day ending VWAP level)
P - Standard Pivot Point
R - RSI (Multi-time frame table is added at the top and traders can add standard RSI 14 as an additional non-overlay indicator)
O - OI data (not available for options trading in TV but trader can always check in their broker terminal)
Double EMA have been color coded in red and green for bullish and bearish trends.
Candles are colored for bullish (green), sideways (grey) and bearish (red) phases.
Setup to be traded with monthly options for stocks and weekly options for indices.
Bullish Setup:
RSI greater than 50
Current candle close above VWAP and previous day closing VWAP
Current candle close above daily Pivot
For option buying (Call option OI should be falling below its moving average 20 meaning short covering)
For option selling (Put option OI should be rising above its moving average 20 meaning Put writers confidence is increasing)
Book partial qty profits at R1/R2/R3 and/or exit completely on Doji candle low break
Bearish Setup:
RSI less than 50
Current candle close below VWAP and previous day closing VWAP
Current candle close below daily Pivot
For option buying (Put option OI should be falling below its moving average 20 meaning short covering)
For option selling (Call option OI should be rising above its moving average 20 meaning Call writers confidence is increasing)
Book partial qty profits at S1/S2/S3 and/or exit completely on Doji candle high break
Open-source Skript
Ganz im Sinne von TradingView hat dieser Autor sein/ihr Script als Open-Source veröffentlicht. Auf diese Weise können nun auch andere Trader das Script rezensieren und die Funktionalität überprüfen. Vielen Dank an den Autor! Sie können das Script kostenlos verwenden, aber eine Wiederveröffentlichung des Codes unterliegt unseren Hausregeln.
Haftungsausschluss
Die Informationen und Veröffentlichungen sind nicht als Finanz-, Anlage-, Handels- oder andere Arten von Ratschlägen oder Empfehlungen gedacht, die von TradingView bereitgestellt oder gebilligt werden, und stellen diese nicht dar. Lesen Sie mehr in den Nutzungsbedingungen.