OPEN-SOURCE SCRIPT
Options Scalping by harsh gbyc
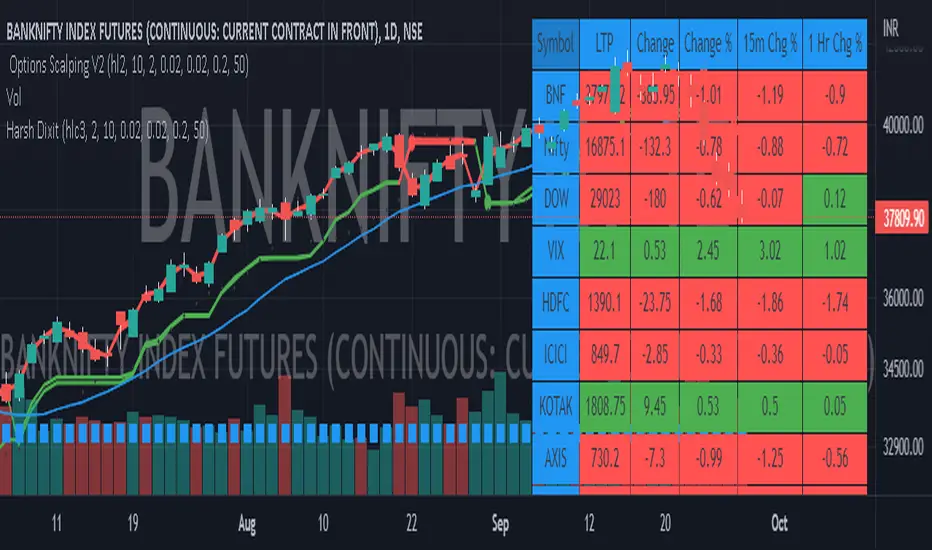
hi this is my script.
Bank Nifty Live OI Change Chart can give very useful clues for intraday support and resistance levels for Bank Nifty. If there is more addition in Open Interest at 12200 Calls, that would mean most market players are comfortable writing call options at this level because they believe it to be a strong resistance. That would be bearish indication for BankNifty.
Similarly is there is highest writing in 12000 Puts that would indicate strong intraday support at that level.
Third Scenario: There is good amount of Open Interest increase in 12000 PE and 12200 CE –> this means we should expect a range bound session for the day, as both bears and bulls are comfortable holding the 12200 and 12000 levels respectively.
Following factors could improve reliability of BankNifty OI Change analysis:
1) Put Call Ratio: Higher PCR means bullishness. If there is more writing at 12000PE and PCR is high and increasing during the day that would add to bullish scenario
If the PCR is declining for the day and more writing happening at 12200CE then this adds to bearishness.
2) Close to expiry: The closer to expiry we are, the more reliable the ‘Open Interest’ analysis. Early in the series, the OI analysis is less reliable.
3) More Players: As the number of players increase, the OI analysis become more reliable.
4) Bid-ask Spread: The lower the bid-ask spread the more reliable the OI analysis.
5) Technical Indicators: The best trades are found by combining OI analysis with other technical indicators. MACD, RSI, Channel lines and EW count give best results with Open Interest Analysis.
Open-source Skript
Ganz im Sinne von TradingView hat dieser Autor sein/ihr Script als Open-Source veröffentlicht. Auf diese Weise können nun auch andere Trader das Script rezensieren und die Funktionalität überprüfen. Vielen Dank an den Autor! Sie können das Script kostenlos verwenden, aber eine Wiederveröffentlichung des Codes unterliegt unseren Hausregeln.
Haftungsausschluss
Die Informationen und Veröffentlichungen sind nicht als Finanz-, Anlage-, Handels- oder andere Arten von Ratschlägen oder Empfehlungen gedacht, die von TradingView bereitgestellt oder gebilligt werden, und stellen diese nicht dar. Lesen Sie mehr in den Nutzungsbedingungen.