OPEN-SOURCE SCRIPT
[RickAtw] S1 Support and resistance
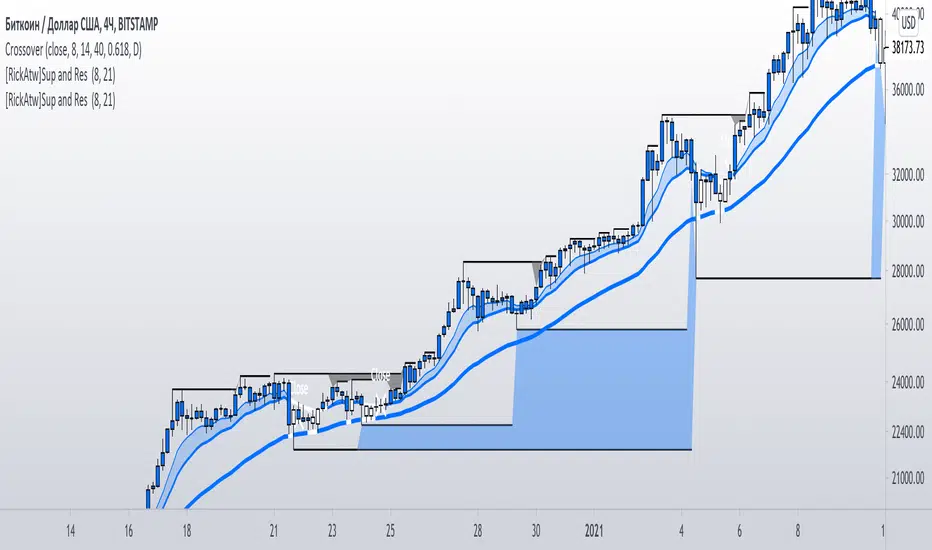
This indicator helps to identify the current support and resistance in the market.
Function
Shows at which points the correction appears and at which points there is resistance
Key Signal
buy ---> If a blue zone forms
sell --->If a black zone forms
Remarks
This helps you determine the approximate support and resistance area.
Since we cannot look into the future, it does not inform you about the exact entries, but it shows who is dominating the market at the moment.
Readme
In real life, I am a professional investor. And I check each of my indicators on my portfolio and how effective it is. I will not post a non-working method. The main thing is to wait for the beginning of trends and make money!
I would be grateful if you subscribe ❤️
Open-source Skript
Ganz im Sinne von TradingView hat dieser Autor sein/ihr Script als Open-Source veröffentlicht. Auf diese Weise können nun auch andere Trader das Script rezensieren und die Funktionalität überprüfen. Vielen Dank an den Autor! Sie können das Script kostenlos verwenden, aber eine Wiederveröffentlichung des Codes unterliegt unseren Hausregeln.
Haftungsausschluss
Die Informationen und Veröffentlichungen sind nicht als Finanz-, Anlage-, Handels- oder andere Arten von Ratschlägen oder Empfehlungen gedacht, die von TradingView bereitgestellt oder gebilligt werden, und stellen diese nicht dar. Lesen Sie mehr in den Nutzungsbedingungen.