OPEN-SOURCE SCRIPT
Aktualisiert Adaptive Trend Channel Indicator
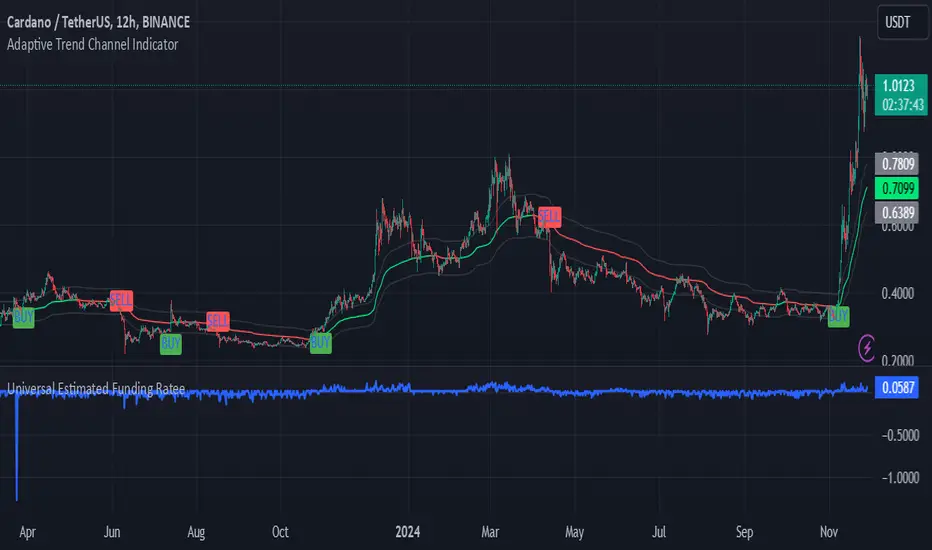
The Adaptive Trend Channel Indicator is a trend-following tool designed to help traders identify buy and sell opportunities by analyzing price action in relation to a dynamic basis line with a customizable buffer zone. This indicator leverages an adaptive moving average to create a responsive trend line, providing insight into market direction and trend strength.
How It Works:
Dynamic Basis Calculation: Using a modified Kaufman’s Adaptive Moving Average (KAMA), the indicator calculates a basis line that adapts to price volatility. The basis line turns green during bullish trends and red during bearish trends, helping to visualize market sentiment.
Buffer Zone for Entry Signals: A buffer zone is calculated around the basis line to filter out false signals in low-volatility or sideways markets. Buy and sell signals are generated only when the price moves beyond this buffer zone, enhancing signal accuracy and reducing noise.
Non-Consecutive Signal Logic: To avoid over-trading, the indicator is programmed to prevent consecutive buy or sell signals in the same direction. This ensures that a new buy signal is only issued after a sell signal, and vice versa, for improved control in trending conditions.
Real-Time Alerts: The indicator issues real-time "Buy" and "Sell" alerts as soon as conditions are met, without waiting for the candle to close. This feature is particularly beneficial for intraday and scalping strategies, where timely entries are crucial.
How to Use:
Buy Signal: A buy signal appears when the basis line is green, and the price moves above the upper buffer zone, indicating a potential uptrend.
Sell Signal: A sell signal appears when the basis line is red, and the price falls below the lower buffer zone, signaling a potential downtrend.
The buffer zone’s sensitivity can be adjusted to adapt the indicator to different trading environments and personal risk tolerance.
Disclaimer: This indicator is designed to support your trading decisions and is best used in combination with other technical analysis tools. It is not intended as standalone financial advice.
Versionshinweise
/Versionshinweise
/Open-source Skript
Ganz im Sinne von TradingView hat dieser Autor sein/ihr Script als Open-Source veröffentlicht. Auf diese Weise können nun auch andere Trader das Script rezensieren und die Funktionalität überprüfen. Vielen Dank an den Autor! Sie können das Script kostenlos verwenden, aber eine Wiederveröffentlichung des Codes unterliegt unseren Hausregeln.
Haftungsausschluss
Die Informationen und Veröffentlichungen sind nicht als Finanz-, Anlage-, Handels- oder andere Arten von Ratschlägen oder Empfehlungen gedacht, die von TradingView bereitgestellt oder gebilligt werden, und stellen diese nicht dar. Lesen Sie mehr in den Nutzungsbedingungen.
Open-source Skript
Ganz im Sinne von TradingView hat dieser Autor sein/ihr Script als Open-Source veröffentlicht. Auf diese Weise können nun auch andere Trader das Script rezensieren und die Funktionalität überprüfen. Vielen Dank an den Autor! Sie können das Script kostenlos verwenden, aber eine Wiederveröffentlichung des Codes unterliegt unseren Hausregeln.
Haftungsausschluss
Die Informationen und Veröffentlichungen sind nicht als Finanz-, Anlage-, Handels- oder andere Arten von Ratschlägen oder Empfehlungen gedacht, die von TradingView bereitgestellt oder gebilligt werden, und stellen diese nicht dar. Lesen Sie mehr in den Nutzungsbedingungen.