OPEN-SOURCE SCRIPT
Aktualisiert Modified Chaikin Oscillator
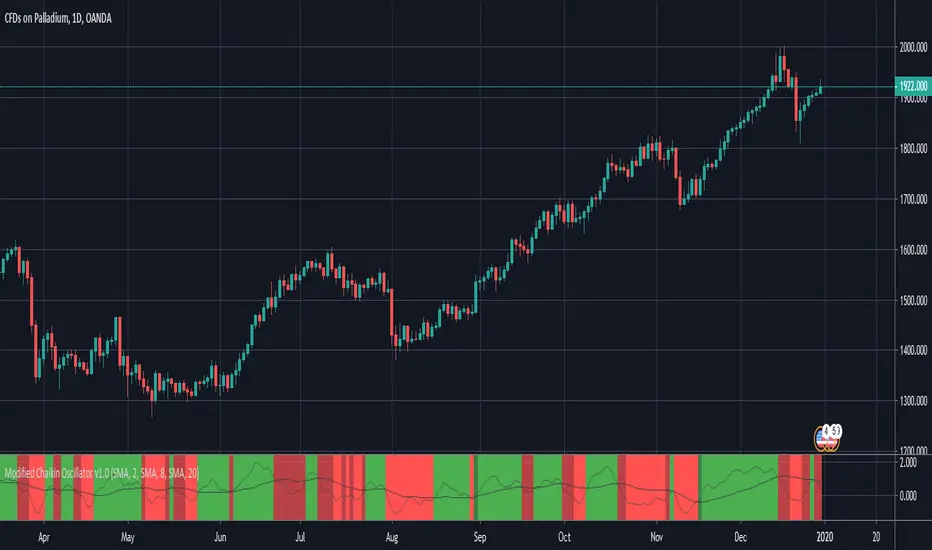
This is a modified version of the Chaikin Oscillator. The idea is to find accumulation and distribution phases in the market to identify when institutions are building their positions.
It uses acc/dist but as an oscillator, just like the Chaikin Oscillator, but not to find overbought or oversold areas, but to find trends. It functions like a MACD. It takes a fast moving average of the acc/dist and a slow moving average of the acc/dist, and plots the differense to create the oscillator, and uses a signal line to use for entries.
A strong signal is when the oscillator crosses the signal line while the signal line is on he right side of 0. So a crossover (long) when the signal line is below 0 woul be a weak signal, while a crossover (long) when the signal line is above 0 would be a strong signal.
By default, tick volume is discarded in the calculation, which makes this version behave a bit differently than the standard Chaikin Oscillator. This is because the indicator is mostly used to trade CFD's. If used to trade stocks for example, it is better to include the volume by unchecking that checkbox in the indicator settings.
BRIGHT GREEN = Strong signal LONG (signal line is above 0)
DARK GREEN = Weak signal LONG (signal line is below 0)
BRIGHT RED = Strong signal SHORT (signal line is below 0)
DARK RED = Weak signal SHORT (signal line is above 0)
Versionshinweise
No changes. New snapshot needed to follow house rules.Open-source Skript
Ganz im Sinne von TradingView hat dieser Autor sein/ihr Script als Open-Source veröffentlicht. Auf diese Weise können nun auch andere Trader das Script rezensieren und die Funktionalität überprüfen. Vielen Dank an den Autor! Sie können das Script kostenlos verwenden, aber eine Wiederveröffentlichung des Codes unterliegt unseren Hausregeln.
Haftungsausschluss
Die Informationen und Veröffentlichungen sind nicht als Finanz-, Anlage-, Handels- oder andere Arten von Ratschlägen oder Empfehlungen gedacht, die von TradingView bereitgestellt oder gebilligt werden, und stellen diese nicht dar. Lesen Sie mehr in den Nutzungsbedingungen.
Open-source Skript
Ganz im Sinne von TradingView hat dieser Autor sein/ihr Script als Open-Source veröffentlicht. Auf diese Weise können nun auch andere Trader das Script rezensieren und die Funktionalität überprüfen. Vielen Dank an den Autor! Sie können das Script kostenlos verwenden, aber eine Wiederveröffentlichung des Codes unterliegt unseren Hausregeln.
Haftungsausschluss
Die Informationen und Veröffentlichungen sind nicht als Finanz-, Anlage-, Handels- oder andere Arten von Ratschlägen oder Empfehlungen gedacht, die von TradingView bereitgestellt oder gebilligt werden, und stellen diese nicht dar. Lesen Sie mehr in den Nutzungsbedingungen.